Rocket Fuel: The Potential Impacts of Major Index Changes This June

Key Takeaways
Index reconstitution can trigger significant trading as funds adjust holdings to match updated benchmarks.
Large trading volumes can impact prices as funds compete to buy or sell securities.
New IPO inclusion rules may accelerate trading activity and demand shifts.
While recent financial news headlines have given a great deal of attention to the slate of expected U.S. mega-cap initial public offerings (IPOs), a few relevant storylines may have slipped under investors' radar.
Despite geopolitical and economic uncertainty in the first five months of 2026, global stock market indexes have quietly posted solid results. The S&P 500® Index is up more than 11% on the year, while non-U.S. stocks (measured by the MSCI ACWI ex-USA Index) are up more than 14%. That’s likely to mean many investors may be pleasantly surprised by their portfolios thus far.
What Is the Russell Index Reconstitution and Why Does It Matter?
Another upcoming event to watch is the annual FTSE Russell index reconstitution, scheduled for the fourth Friday in June.1 On that day, Russell will reclassify the holdings in its U.S. indexes for the first time since last June.
Stocks will be placed in the various indexes based on the underlying firm’s characteristics, such as its market capitalization, the price multiple at which it trades relative to its book value, or changes in its earnings. Figure 1 summarizes notable changes coming to commonly watched Russell U.S. indexes.
Figure 1 | June 2026 Russell Index Reconstitution Highlights
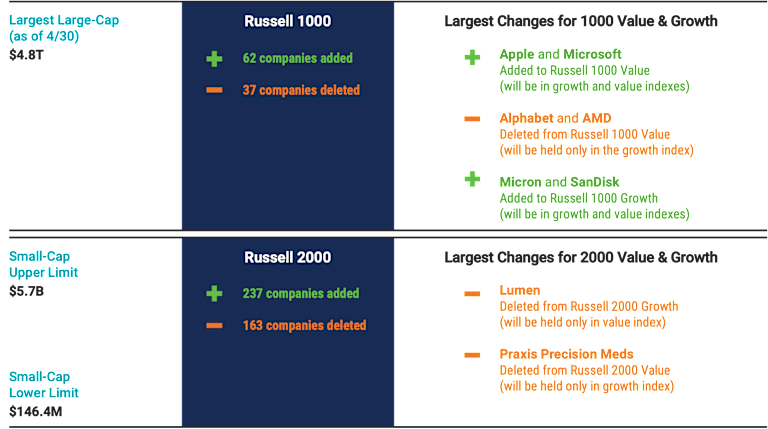
Sources: Avantis Investors, FTSE Russell.
How Does Index Rebalancing Drive Trading Volume?
What may seem like routine index maintenance can have real implications for investors. When Russell reconstitutes its indexes, funds and investors attempting to track those indexes must place trades to:
Sell securities leaving each index.
Buy securities joining each index.
Buy or sell securities to adjust the old weights of securities staying in each index to their new weights.
Given the substantial assets in funds tracking Russell’s U.S. market indexes (estimated at more than $12 trillion as of June 2025), this annual event triggers significant single-day turnover for those funds and their investors.
As a result of the reconstitution, Jefferies anticipates about $350 billion in trades at the end of the day on June 26, driven solely by index funds, up from about $220 billion traded around the 2025 Russell reconstitution. Figure 2 presents the expected dollar amount that index funds tracking various Russell indexes will trade.
Figure 2 | Huge Sums Will Trade Hands in June as Index Funds Aim to Stay in Line with Announced Russell Index Changes
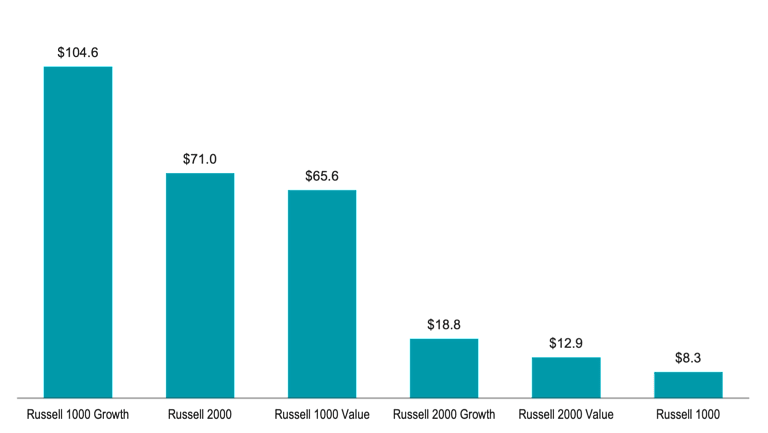
Estimates as of 5/22/2026. Sources: Avantis Investors, Jefferies.
The considerable trading activity triggered by the Russell reconstitution makes this one of the highest aggregate trading volume days in the U.S. market each year. The impact on traded volume at the individual security level can also be significant, not just in small-caps, where average trading volumes tend to be lower.
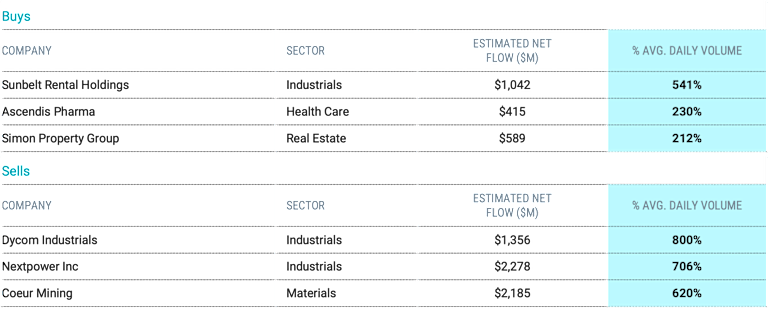
As shown in Figure 3, many names moving between indexes or changing weights will need to trade at volumes hundreds or thousands of times higher than typical for these stocks.
Figure 3 | Too Much to Trade?
Highest Expected % of Average Daily Trading Volume among Largest Announced Buys and Sells during the June 2026 Reconstitution
Panel A | Russell 1000
Panel B | Russell 2000
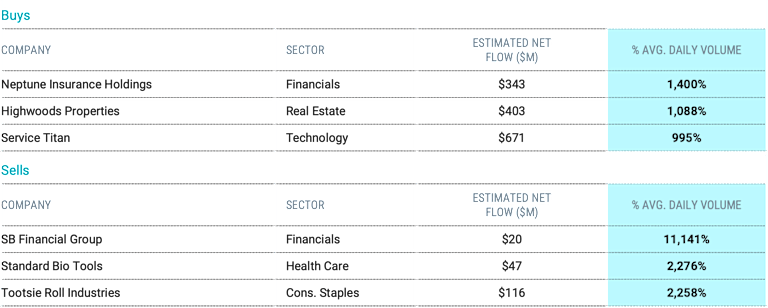
Sources: Avantis Investors, Jefferies.
The data prompts an important question: Does it really make sense to force all this trading into a single day? Most would agree that attempting to trade multiples of a security’s typical volume should come at a cost.
If an index fund is required to buy or sell stocks in order to closely track its benchmark, what motivates the other side of the trade to participate? Price is often that incentive, and it typically means paying higher prices for the stocks that need to be acquired and lower prices for the stocks that need to be sold.
Several studies have sought to measure the impact of high liquidity demands around index rebalance events. For example, one study estimated that funds tracking the Russell 2000 Index lost between 1.30% and 1.84% per year as a result of the liquidity demands around its annual reconstitution and related investor arbitrage activity (i.e., investors buying securities known to be demanded by index funds to earn a profit from their need for immediacy at reconstitution).2 While various studies on different samples may yield varying results, what’s clear is that the unseen costs of infrequent index rebalancing can be meaningful.
How Do IPO Inclusions Affect Index Funds and Prices?
Now, back to those highly anticipated mega-cap IPOs painting headlines. This same liquidity-demanding dynamic is likely to be at play as index providers respond to the inclusion of these companies in market indexes. New IPO inclusion rule changes for Russell and other index providers may exacerbate the impact on index fund investors.
Russell recently announced plans to “fast-track” the inclusion of large IPOs such as SpaceX, Anthropic and OpenAI. Companies that meet the fast-track requirements (e.g., those within the size range of the 500 largest companies) will be eligible for inclusion after five trading days.
This fast-tracking approach has precedent. The Center for Research in Security Prices (CRSP) has fast-tracked larger IPOs (inclusion after five trading days) since 2017, providing a dataset for research into the potential impacts of index providers adopting a similar approach.
A 2025 study found that fast-tracked IPOs, on average, outperformed non-fast-tracked IPOs by more than 5% from the IPO close date through the index inclusion date (the 5th trading day). After being added to the indexes (and index funds tracking them), price gains quickly reverted on average.
Figure 4 summarizes the findings over the sample from 2017 through 2023. While a relatively small sample, the results suggest investors may buy up shares of popular IPOs, knowing that index fund managers will soon have strong demand to acquire them to keep their funds in line with the index they track.
These hidden potential costs, whether from recurring index rebalancing events or new IPO inclusions, are often unknown to index fund investors, yet research shows they can be meaningful. Importantly, it’s not the only option.
We believe investors can do better by avoiding purchases of companies around the time they’re announced for addition to market indexes. This helps mitigate the risk of buying at elevated prices that often accompany high short-term demand for these securities.
Further, a process that allocates investor assets based on current (rather than stale) information to determine which securities to buy or sell and at what weights is expected to add value over time. This doesn’t mean investors have to trade a lot each day, only what’s necessary to keep the portfolio in the desired position. This method allows for consistent focus on the desired asset class rather than forced trades made only once or twice a year.
Figure 4 | CRSP Index Fast-Tracked IPOs Have, on Average, Cost Index-Tracking Funds
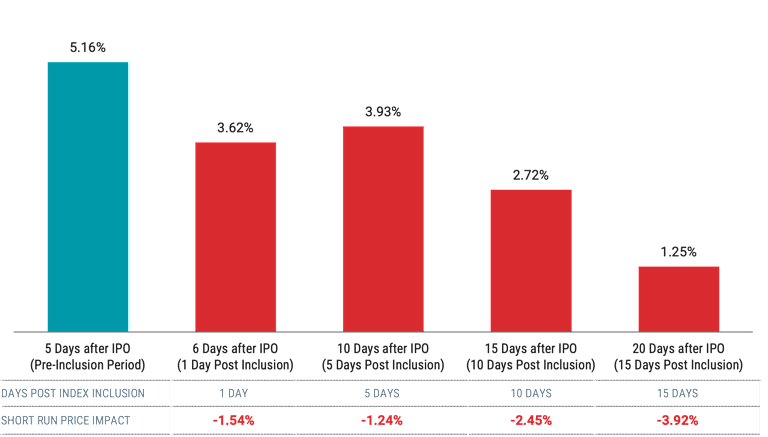
Data from 2017 – 2023. Source: Chris Murray and Marco Sammon, “Primary Capital Market Transactions and Index Funds,” July 2025. Available at SSRN. Short run price impact is the difference between the fast-track IPO return premium over the 5 days after IPO (pre-index inclusion) and the return premium from IPO through day 6/10/15/20 thereafter. The results show that the outperformance observed in the 5 days after IPO (prior to index inclusion) has on average dissipated materially in the weeks after index inclusion (after the first 5 days from IPO).
Explore More Insights
Russell announced that the June 2026 reconstitution will be the final annual rebalance of its U.S. equity indexes. Going forward, the indexes will be reconstituted semi-annually (June and December) starting in December 2026.
Honghui Chen, Gregory Noronha, and Vijay Singal. “Index Changes and Unexpected Losses to Investors in S&P 500 and Russell 2000 Index Funds,” March 2005. Available at SSRN.
Glossary
Book-to-Market Ratio:
Compares a company’s book value relative to its market capitalization. Book value is generally a firm’s reported assets minus its liabilities on its balance sheet. A firm's market capitalization is calculated by taking its share price and multiplying it by the number of shares it has outstanding.
Liquidity:
Describes the degree to which an asset or security can be quickly bought or sold in the market without affecting the asset's price.
Market Capitalization:
The market value of all the equity of a company's common and preferred shares. It is usually estimated by multiplying the stock price by the number of shares for each share class and summing the results.
MSCI ACWI ex-USA Index:
A market capitalization-weighted index that is designed to measure the equity market performance of developed and emerging markets, excluding the United States.
Russell 1000® Growth Index:
Measures the performance of those Russell 1000 Index companies (the 1,000 largest publicly traded U.S. companies, based on total market capitalization) with higher price-to-book ratios and higher forecasted growth values.
Russell 1000® Index:
A market-capitalization weighted, large-cap index created by Frank Russell Company to measure the performance of the 1,000 largest publicly traded U.S. companies, based on total market capitalization.
Russell 1000® Value Index:
Measures the performance of those Russell 1000 Index companies (the 1,000 largest publicly traded U.S. companies, based on total market capitalization) with lower price-to-book ratios and lower forecasted growth values.
Russell 2000® Growth Index:
Measures the performance of those Russell 2000 Index companies (the 2,000 smallest of the 3,000 largest publicly traded U.S. companies, based on total market capitalization) with higher price-to-book ratios and higher forecasted growth values.
Russell 2000® Index:
Measures the performance of the 2,000 smallest companies among the 3,000 largest publicly traded U.S. companies, based on total market capitalization.
Russell 2000® Value Index:
Measures the performance of those Russell 2000 Index companies (the 2,000 smallest of the 3,000 largest publicly traded U.S. companies, based on total market capitalization) with lower price-to-book ratios and lower forecasted growth values.
S&P 500® Index:
A market-capitalization-weighted index of the 500 largest U.S. publicly traded companies. The index is widely regarded as the best gauge of large-cap U.S. equities.
Investment in an IPO can involve heightened risk compared to seasoned securities and include the possible loss of principal. IPOs typically have a limited operating history, less publicly available information and no established market price prior to the offering. This may lead to price volatility, especially in early trading and post-IPO due to “lock‑up expirations” that may pressure prices.
References to specific securities are for illustrative purposes only and are not intended as recommendations to purchase or sell securities. Opinions and estimates offered constitute our judgment and, along with other portfolio data, are subject to change without notice.
Investment return and principal value of security investments will fluctuate. The value at the time of redemption may be more or less than the original cost. Past performance is no guarantee of future results.
The opinions expressed are those of American Century Investments (or the portfolio manager) and are no guarantee of the future performance of any American Century Investments portfolio. This material has been prepared for educational purposes only. It is not intended to provide, and should not be relied upon for, investment, accounting, legal or tax advice.