
The Evolution of Global Markets

Key Takeaways
Global markets have expanded since 2010, with regional differences in fundamentals shaping the story beneath returns.
Many emerging markets saw book equity grow faster than market cap, highlighting a different growth profile.
In this article, we highlight why valuations and global diversification remain important when market fundamentals diverge.
A lot has changed over the past 15 years. In 2010, the iPad had just been introduced, Facebook was the dominant social media platform (TikTok, who?), and hailing a ride meant standing on a street corner rather than opening the Uber app.
Just as our daily lives have evolved since then, so too have financial markets. And while a great deal of investor attention focuses on returns, a closer look beneath the surface reveals a more nuanced story about how markets around the world have grown and how these changes have been reflected in fundamentals.
How Has Global Market Growth Varied by Region?
Over the past 15 years, companies in the U.S., non-U.S. developed, and emerging markets (EM) have invested in their businesses, driving substantial growth in book equity (assets minus liabilities), earnings and market capitalization. However, the rate and nature of that growth have varied across regions.
Figure 1 highlights these differences by comparing the growth rates of key fundamentals by region from 2010 to 2025.
Figure 1 | The U.S. Isn’t the Only Market That’s Growing

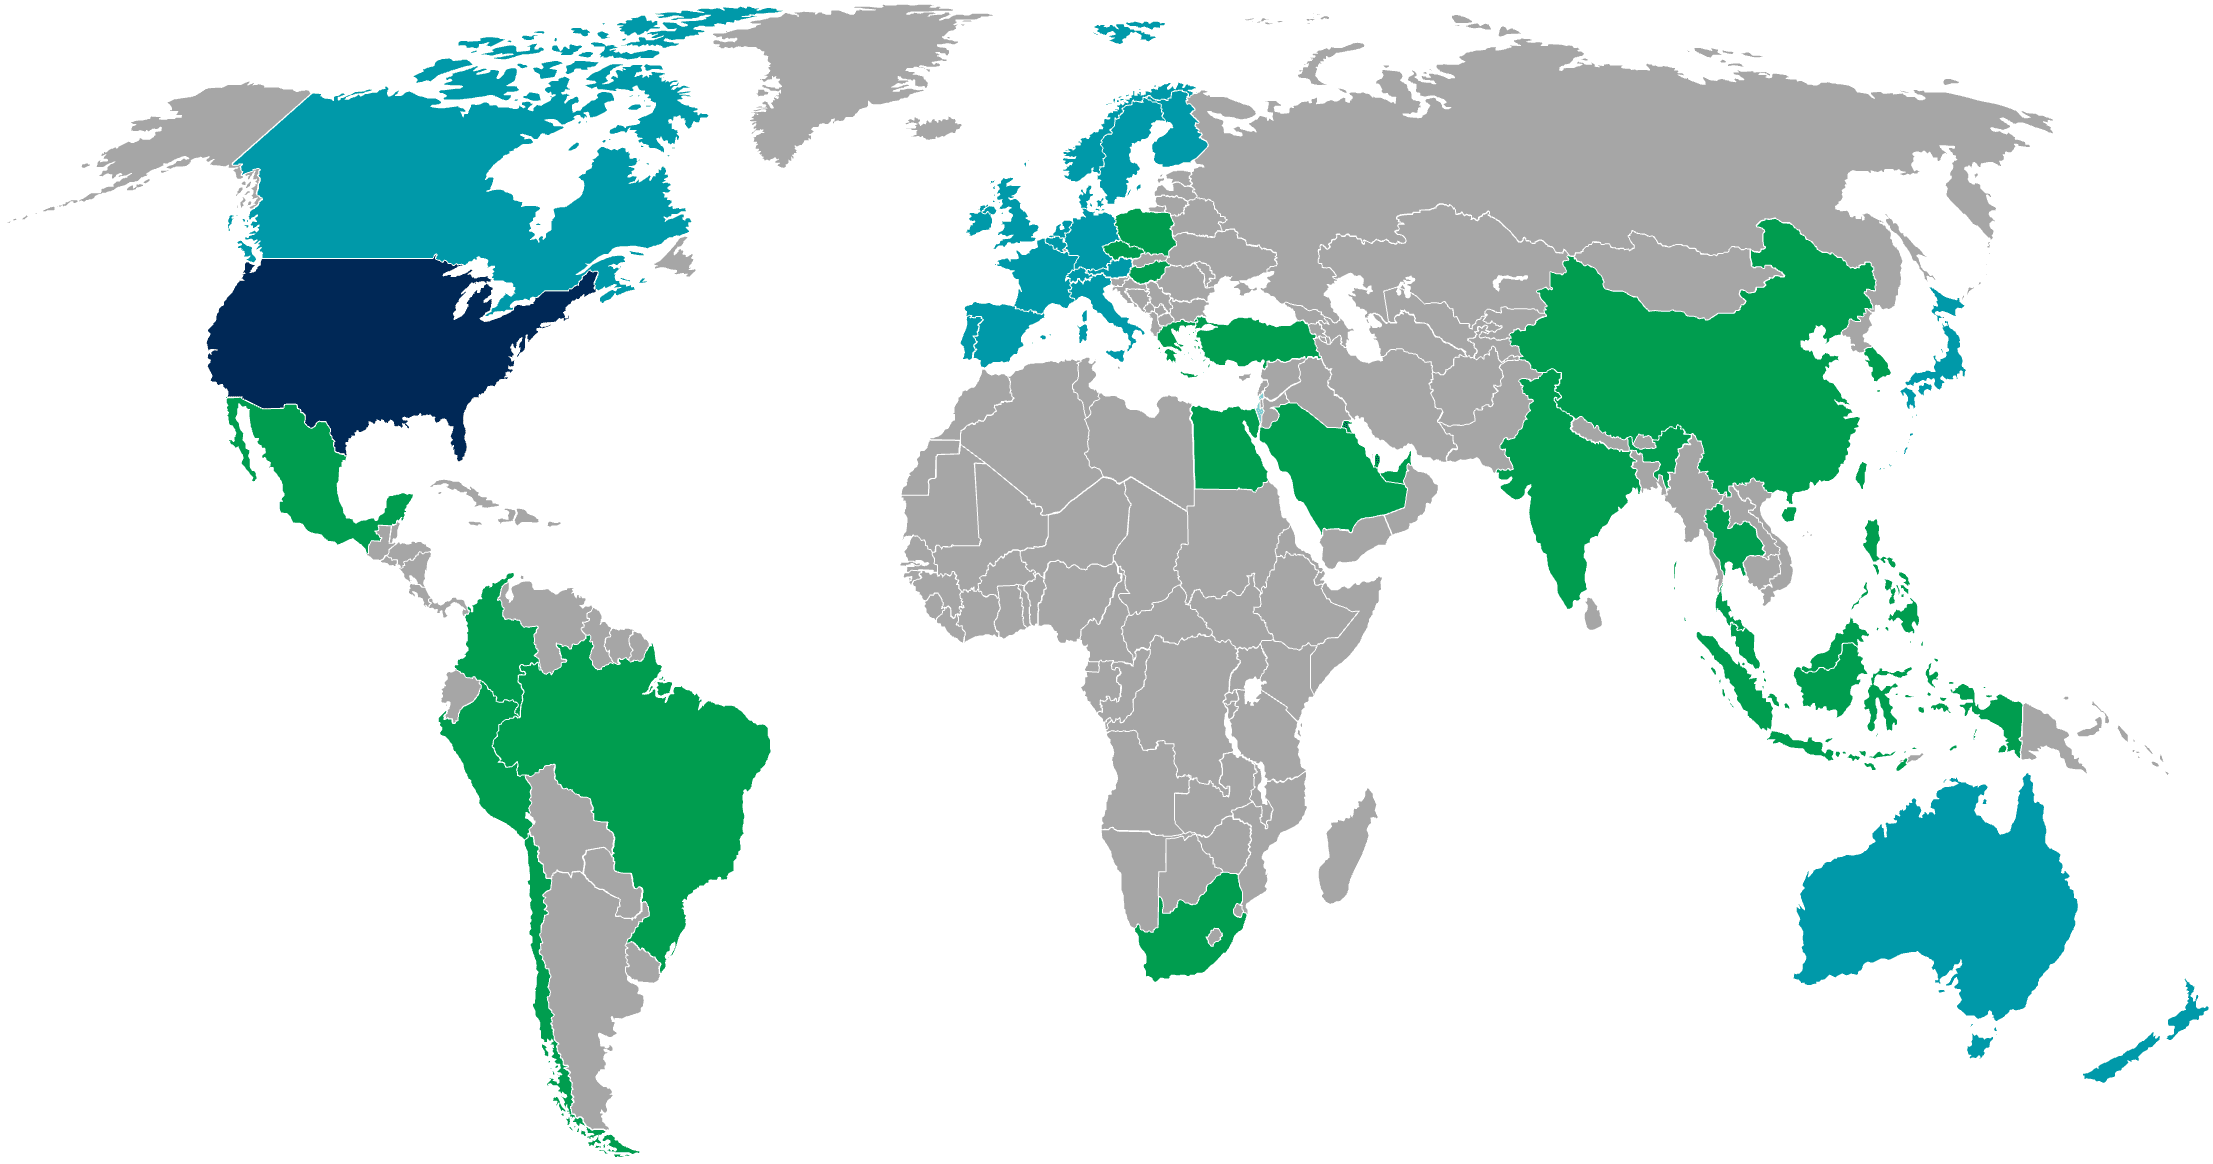
Data from 12/31/2010 – 12/31/2025. Sources: Avantis Investors, FactSet. The U.S. market is represented by the Russell 3000® Index. Non-U.S. developed markets are represented by the MSCI World ex-USA IMI. Emerging markets are represented by the MSCI Emerging Markets IMI.
The U.S. stands out for its exceptional market capitalization growth, rising 361% over the period and topping emerging markets at 224% and developed non-U.S. markets at 86%. Importantly, this growth captures more than market performance.
Market capitalization can also increase when new companies go public. Think back to Meta in the U.S., Shopify in Canada, and Saudi Aramco in Saudi Arabia — all examples from the past 15 years. Existing companies may also raise additional capital, while other corporate actions can cause companies to be delisted or merge across jurisdictions, as seen in the 2025 acquisition of U.S. Steel by Nippon Steel. These factors combine to affect the size of each market.
And while all markets have grown in size, increases in fundamental metrics, including book equity and earnings, haven’t been constant across regions. What stands out in this data is the strong growth rates in emerging markets compared to their developed counterparts.
Growth in book equity was by far the highest in emerging markets at 242% — more than double the U.S. at 110% and many multiples higher than developed non-U.S. markets at 40%. Underlying the considerable book equity growth (also viewed as net positive investment) in emerging markets are meaningful increases in both assets and liabilities — each at more than 300%. However, despite the increase in liabilities, leverage (measured as liabilities over assets) changed little over the period. Further, the leverage ratio for emerging markets is similar to that of the U.S. market, with both regions in the range of 0.75 to 0.80 at the end of the period.
Earnings growth in emerging markets at 175% was also nearly as high as the U.S. market’s 192% growth rate. Developed non-U.S. markets again lagged the other regions, with earnings growth of 65%.
Taking price (market capitalization) and fundamental changes together, a key takeaway is that the U.S. market has realized clear multiple expansion, as its market capitalization has risen at a much higher rate than book equity and earnings. Emerging markets stand in contrast, as market cap rose at a lower rate than book equity and more similar to its earnings growth than in the U.S.
What Is Driving Emerging Markets Growth?
To provide additional context in emerging markets, we examine these same metrics at the country level. Figure 2 plots book equity growth against earnings growth for individual emerging market countries. These figures, along with the change in market capitalization, are also listed in table form.
Figure 2 | Emerging Markets Growth Isn’t Limited to Outliers
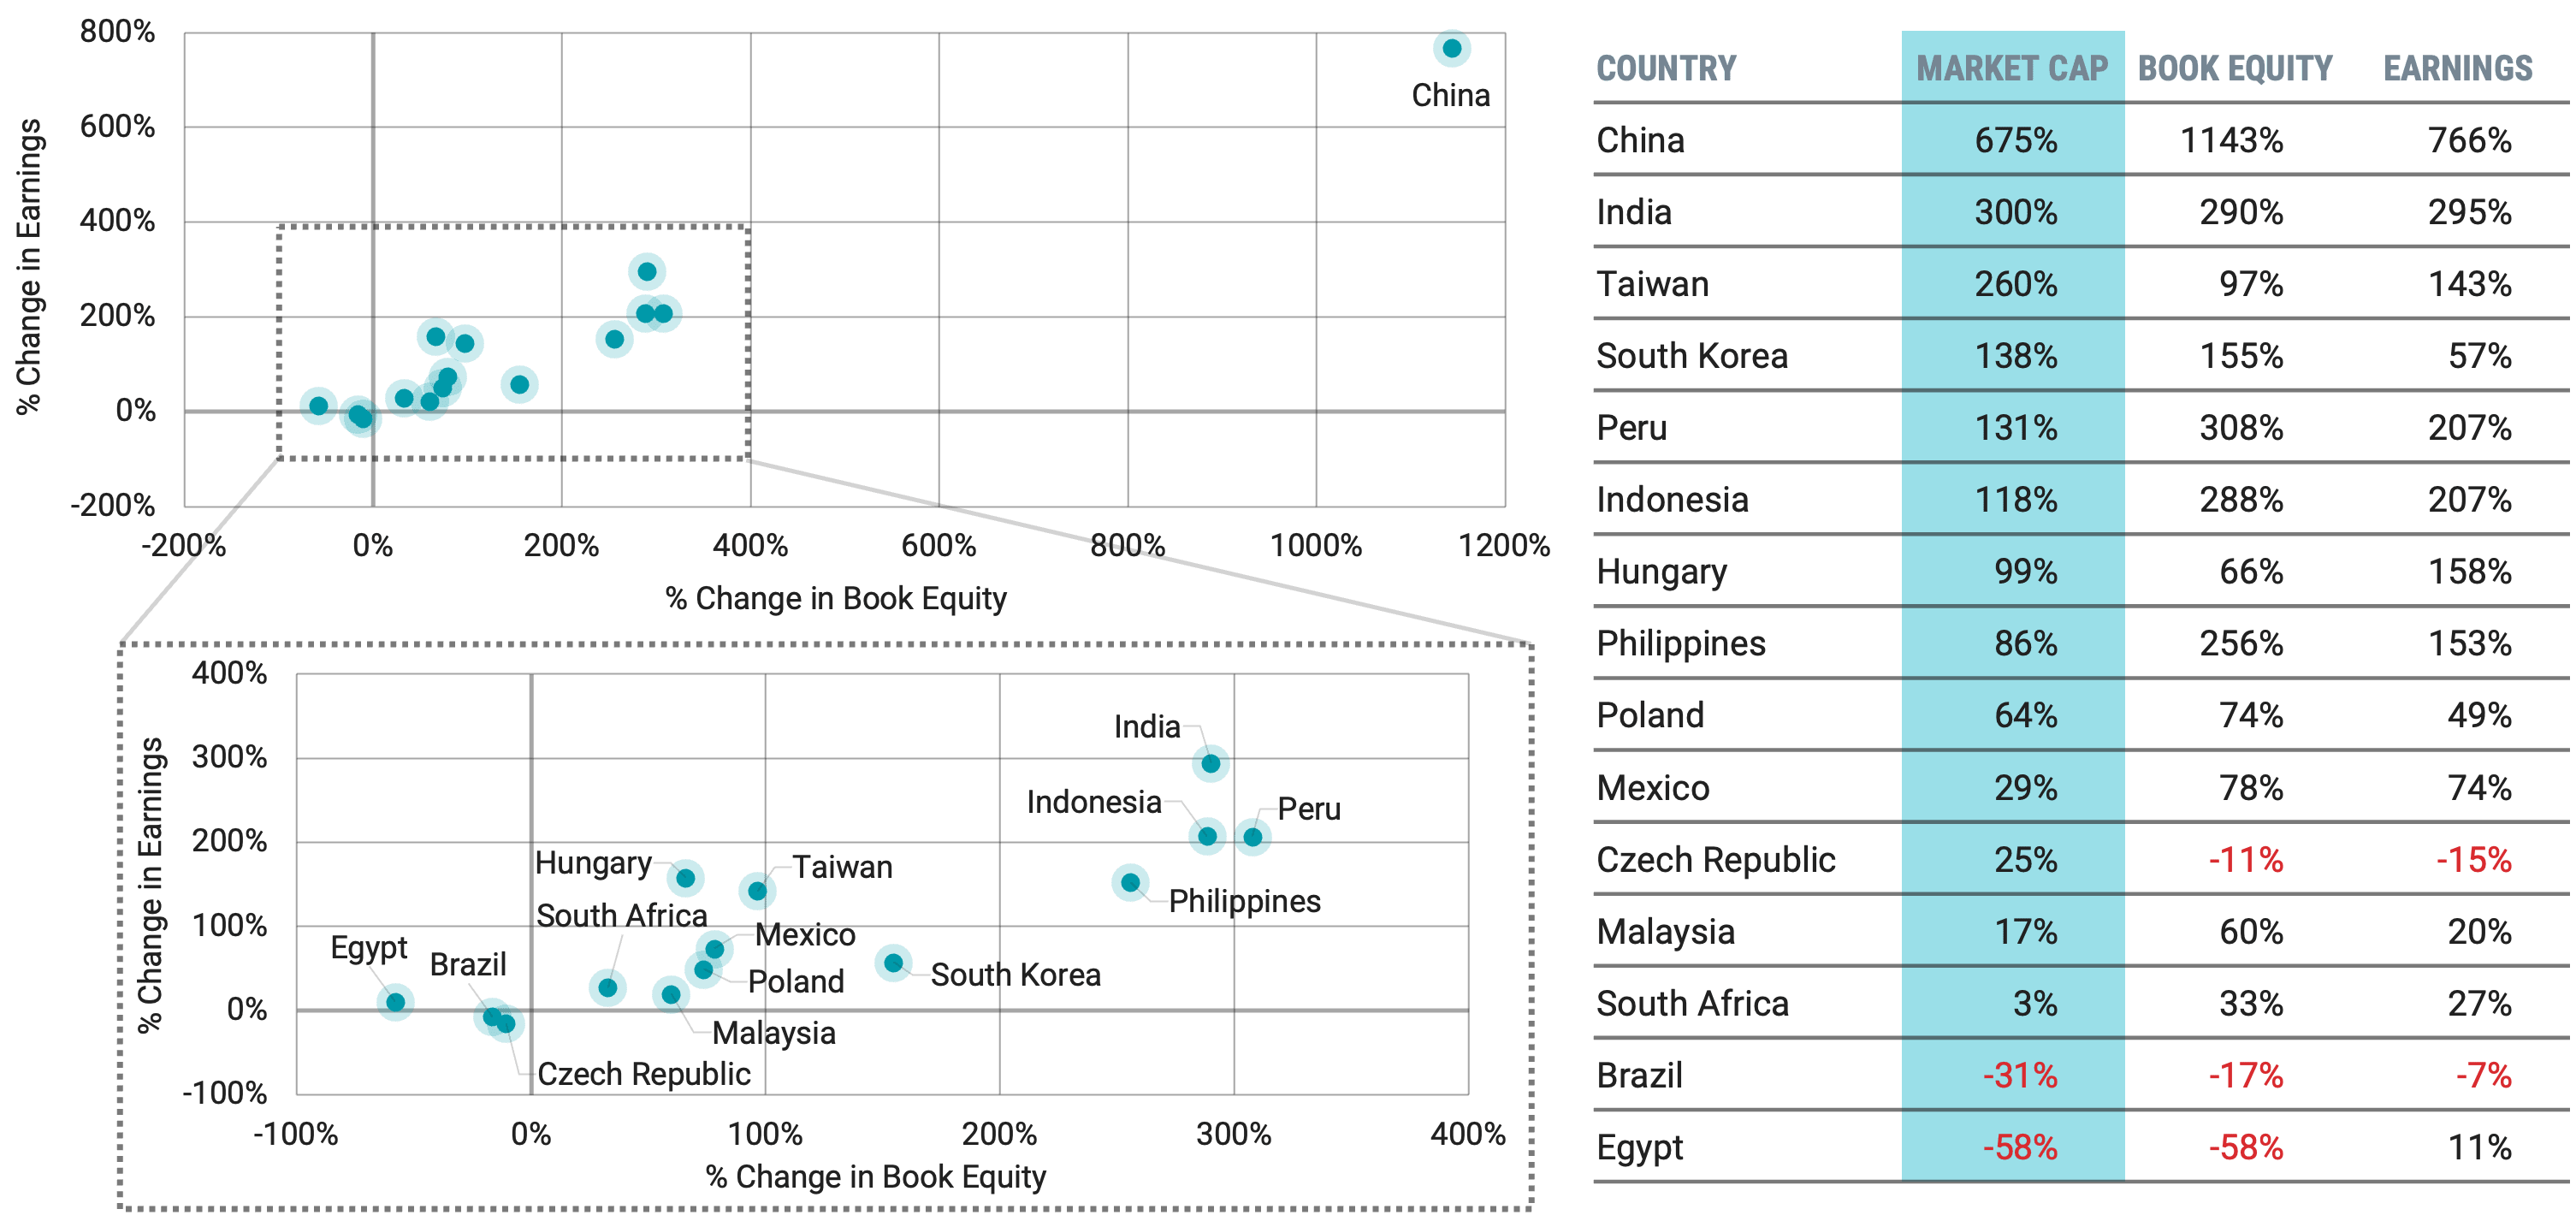
Data from 12/31/2010 – 12/31/2025. Sources: Avantis Investors, FactSet. Countries are represented by their respective MSCI IMI indexes.
Many individual emerging markets saw higher growth in book equity than in market capitalization over the period. Further, countries with the largest increases in book equity also tended to experience some of the strongest earnings growth rates.
China stands out, with book equity rising 1,143% and earnings rising 766% between 2010 and 2025. Other markets, including India, Taiwan and South Korea, also saw significant growth in both measures over the period. Notably, these countries each play a meaningful role in producing and manufacturing goods and services for markets worldwide.
While the magnitude of the results varies across countries, the strong growth in EM fundamentals has generally been broad-based rather than concentrated in only a few markets.
How Do U.S. and Non-U.S. Valuations Compare?
The data in Figure 1 suggests that we’ve seen sizable changes in valuation metrics, such as price-to-book (P/B) and price-to-earnings (P/E), within some regions and relative to one another over the last 15 years. Figure 3 provides full details on regional valuations.
In Panel A, we show P/B and P/E at the end of 2010 and 2025, along with the percentage change over that period for each of the U.S., non-U.S. developed and EM indexes. The aforementioned multiple expansion in the U.S. market is clear in the data, with P/B rising by 120% and P/E increasing by 63%. We observe much more modest changes in valuation ratios for non-U.S. markets. P/B in emerging markets even declined slightly over the period, as investment drove higher book equity growth than market cap growth.
Panel B offers another view of relative valuations over the full 15-year period, highlighting how valuation metrics have differed between the U.S. and non-U.S. markets. This is referred to as a valuation spread. The data shows that valuation metrics for non-U.S. markets were lower than those for the U.S. market at the start of the period (as reflected in the negative values in the chart). Historically, this has generally been the case. However, the relative difference has grown considerably over the last 15 years due to greater multiple expansion in the U.S. market, resulting in wider valuation spreads.
Figure 3 | U.S. Market Valuation Multiples Have Expanded at a Far Higher Rate than Non-U.S. Markets

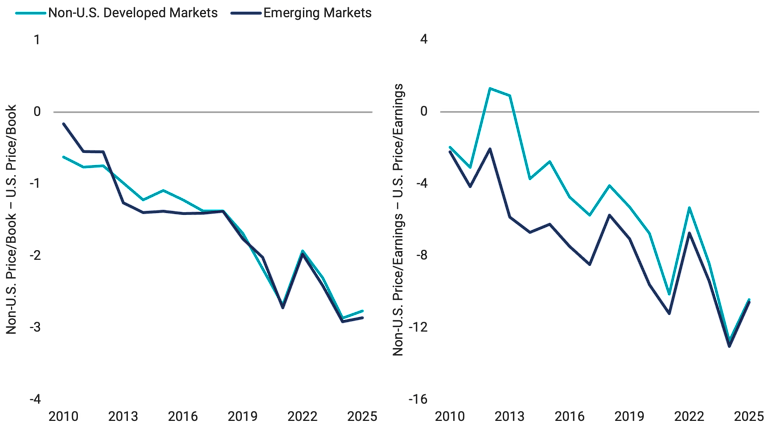
Data from 12/31/2010 – 12/31/2025. Sources: Avantis Investors, FactSet. The U.S. market is represented by the Russell 3000® Index. Non-U.S. developed markets are represented by the MSCI World ex-USA IMI. Emerging markets are represented by the MSCI Emerging Markets IMI.
What Can Investors Learn From Global Market Changes?
Markets are constantly evolving as new companies list, existing companies invest in their businesses, merge or change jurisdictions, and investors allocate capital in search of growth over time. What we have observed in global markets over the last 15 years offers a few important reminders for investors.
Strong fundamental growth may come from companies and markets far from where we live, or from places we might not expect based on what we read in the news.
Investors who maintain broad diversification across global markets can be confident they are positioned to participate in growth wherever it occurs.
Valuations matter. Sometimes market prices rise faster than their underlying fundamentals support. In other markets, fundamentals may rise without commensurate increases in prices.
By diversifying across global markets, we can be assured of always having some exposure to those areas of the world that offer the most attractive relative valuations.
Explore More Insights
Glossary
Book Equity: Total assets minus total liabilities and represents the aggregate accounting value of shareholders' equity across companies within a region.
Earnings Growth: The percentage change in aggregate earnings for companies within a region over the period analyzed.
Fundamentals: Investment "fundamentals," in the context of investment analysis, are typically those factors used in determining value that are more economic (growth, interest rates, inflation, employment) and/or financial (income, expenses, assets, credit quality) in nature, as opposed to "technicals," which are based more on market price (into which fundamental factors are considered to have been "priced in"), trend, and volume factors (such as supply and demand), and momentum. Technical factors can often override fundamentals in near-term investor and market behavior, but, in theory, investments with strong fundamental supports should maintain their value and perform relatively well over long time periods.
Leverage Ratio: Total liabilities divided by total assets and represents the proportion of aggregate assets financed through liabilities across companies within a region.
Market Capitalization: The market value of all the equity of a company's common and preferred shares. It is usually estimated by multiplying the stock price by the number of shares for each share class and summing the results.
MSCI Emerging Markets IMI: Captures large-, mid- and small-cap securities across 27 emerging markets countries.
MSCI World ex USA IMI: Captures large-, mid- and small-cap representation across 22 of 23 developed markets countries, excluding the U.S.
Price-to-Book Ratio (P/B): Measures a company’s current market price relative to its book value. It is calculated by dividing the stock price per share by book value per share. Book value is generally a firm’s reported assets minus its liabilities on its balance sheet.
Price-to-Earnings Ratio (P/E): The price of a stock divided by its annual earnings per share. These earnings can be historical (the most recent 12 months) or forward-looking (an estimate of the next 12 months). A P/E ratio allows analysts to compare stocks on the basis of how much an investor is paying (in terms of price) for a dollar of recent or expected earnings. Higher P/E ratios imply that a stock's earnings are valued more highly, usually on the basis of higher expected earnings growth in the future or higher quality of earnings.
Russell 3000® Index: Measures the performance of the largest 3,000 U.S. companies representing approximately 98% of the investable U.S. equity market.
International investing involves special risks, such as political instability and currency fluctuations. Investing in emerging markets may accentuate these risks.
Investment return and principal value of security investments will fluctuate. The value at the time of redemption may be more or less than the original cost. Past performance is no guarantee of future results.
Diversification does not assure a profit nor does it protect against loss of principal.
This material has been prepared for educational purposes only. It is not intended to provide, and should not be relied upon for, investment, accounting, legal or tax advice.
References to specific securities are for illustrative purposes only and are not intended as recommendations to purchase or sell securities. Opinions and estimates offered constitute our judgment and, along with other portfolio data, are subject to change without notice.