Beyond the Hype: What Investors Need to Know About Mega-IPOs

Key Takeaways
Mega-IPOs may draw hype and record valuations, but past high-profile IPOs often saw early volatility and lagged returns after listing.
Research shows IPOs have trailed similar public firms over time, often linked to lower profitability and factors beyond initial lockups.
Index inclusion and fund flows can lift prices near entry, so assessing IPOs with a focus on price, profits and flexibility is critical.
News of initial public offerings (IPOs) by well-known private companies typically makes headlines. The expected IPOs of SpaceX, OpenAI and Anthropic are no exception in this respect.
What’s unusual about these highly anticipated IPOs is their size. SpaceX is reportedly seeking a valuation of $1.75 trillion to $2 trillion, while OpenAI and Anthropic are both expected to price their IPOs at valuations near $1 trillion or more.
The current record valuation, or market capitalization, at IPO is $1.7 trillion for Saudi Aramco in 2019. Alibaba holds the mantle for the largest IPO on a U.S. stock exchange, with a market capitalization of about $169 billion.
SpaceX could become the largest IPO ever by total valuation and immediately jump into the top 10 of the world’s largest publicly traded companies.
For added context, Figure 1 shows how SpaceX, with a market capitalization of $1.8 trillion, would compare in size to the largest IPOs we’ve seen to date, as well as some of today’s largest publicly traded companies.
Figure 1 | SpaceX Could List at a Similar Size to Some of Today’s Largest Companies
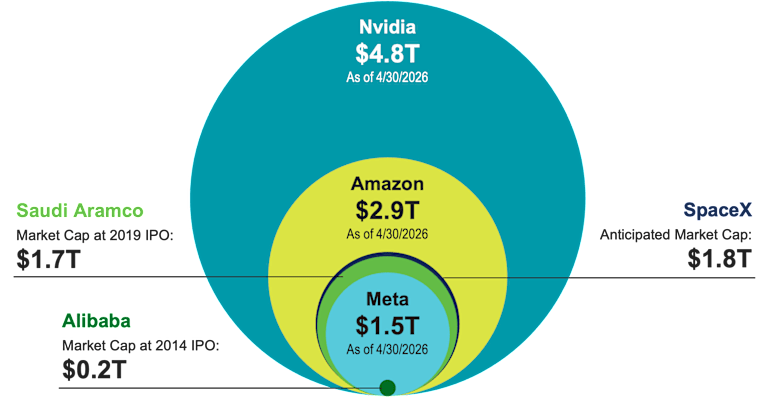
Data as of 4/30/2026. Sources: Avantis Investors, Bloomberg, Reuters. Nvidia, Amazon, Meta market capitalization figures as of 4/30/2026. Saudi Aramco and Alibaba market capitalizations are at the time of their respective IPOs. SpaceX market capitalization is an anticipated level for its expected IPO in late 2026.
Should Investors Include IPOs in Their Portfolios?
It’s easy to see why there’s buzz about these companies going public, but whether they should be viewed as good investments when they hit the market is a separate issue.
Consider past high-profile IPOs from Facebook (now Meta) and Uber. Both companies managed widely used consumer products, and their IPOs were the first opportunities for everyday investors to own shares in these businesses.
Four months after the Facebook/Meta IPO in May 2012, the stock declined by more than 50% and took over a year to return to its IPO price.
Similarly, Uber saw its price slide by about a third in the first five months and also took more than a year to trade consistently above its IPO price.
While these are just two examples of the thousands of IPOs over time, their results aren’t outside the norm. In fact, a broad body of research has shown that, on average, IPOs have historically underperformed for some time after listing relative to similar companies that have traded publicly for years.
Some have attributed this result to the expiration of shareholder lockups, which prevent company insiders from selling their shares until, typically, at least six months after an IPO. The theory is that once these previously restricted shares are made available for sale in the market, the additional supply creates downward selling pressure on the company’s stock price, leading to lower returns for IPOs in the first year after listing.
However, IPO underperformance generally persists beyond one year, as shown in Figure 2. Between 1980 and 2024, the average annualized return for IPOs over the five years after listing trailed already-listed peer companies with similar market capitalization and book equity-to-price characteristics by about 2%. The expiration of insider lockups may contribute to some short-term underperformance, but it doesn’t explain the longer-term outcomes.
Figure 2 | U.S. IPOs on Average Underperform Companies of Similar Size and Valuations in the First Five Years After Listing
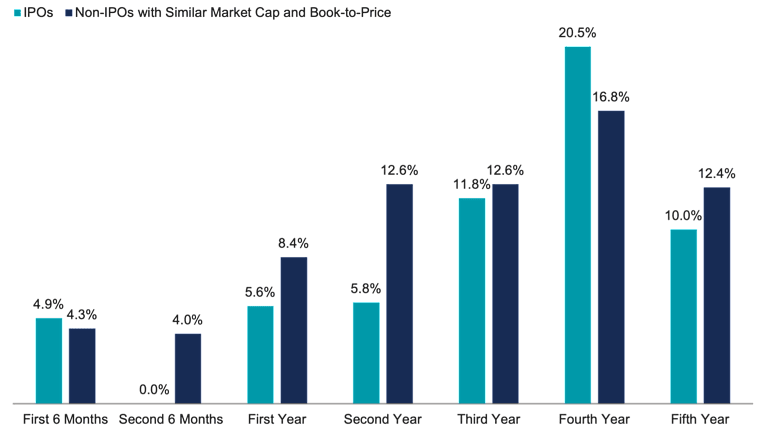
Data from 1/1/1980 – 12/31/2024. Source: Jay Ritter, “Initial Public Offerings: Updated Long-Run Statistics,” Warrington College of Business, University of Florida, March 23, 2026. Past performance is no guarantee of future results.
One noticeable characteristic missing from the selection of listed peer companies for performance comparison is company profitability. This is important because if IPOs have much lower profitability than their already-listed peers, they should have lower expected returns.
As it turns out, many IPOs were not profitable when they were listed. Figure 3 shows the percentage of IPOs with negative trailing 12-month earnings for each calendar year since 1980. This suggests many IPOs were likely listed at a similar size and book-to-price to older public companies, but with much lower profitability, which implies lower expected returns.
Figure 3 | A High Percentage of IPOs Are Unprofitable
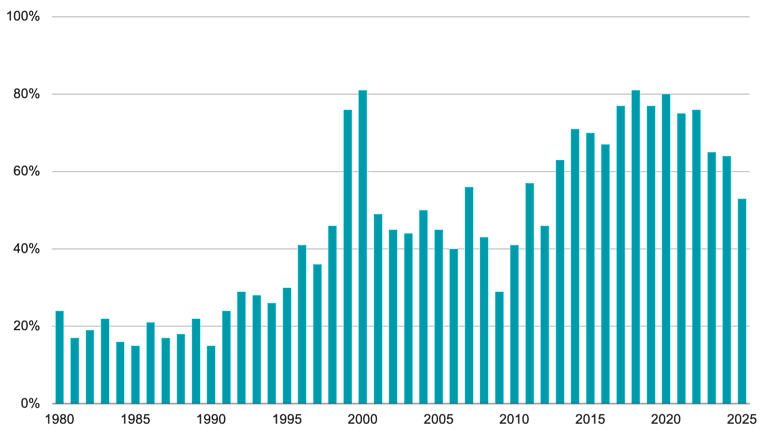
Data from 1/1/1980 – 12/31/2025. Source: Jay Ritter, “Initial Public Offerings: Updated Statistics,” Warrington College of Business, University of Florida, April 14, 2026.
The takeaway is not that all IPOs are therefore inherently low-expected-return investments. We need a full set of financials — not just book value and price — to assess their expected return. The price of the company, its equity and its profits are all critical for understanding how an IPO compares to other companies and what allocation, if any, it should have in a portfolio.
How Index Providers Are Approaching Mega-IPOs
A subtopic within the news about the upcoming mega-cap IPOs is how index providers are preparing for their arrival in the market. Of note is a recent proposal from S&P that would drop its long-held requirement that companies trade publicly for at least 12 months before being admitted to the S&P 500® Index.
For companies among the largest 100 by valuation, the proposal would also eliminate their current requirement to have one full year of positive profits. Reporting indicates the profitability restriction would remain for companies below the 100 largest.
S&P’s current criterion famously prevented Tesla, which went public in 2010, from being added to the S&P 500 until 2020, even though it was already among the 100 largest U.S. companies. Public knowledge of OpenAI and Anthropic earnings suggests that each would likely fail to meet the current profitability screens if S&P were to make no changes to its methodology.
Other index providers, such as Russell, MSCI and Nasdaq, are currently evaluating their index rules as well. It’s yet to be determined exactly what changes will be made and how quickly the mega-cap IPOs will be included. There are also considerations for the weight each company could have in each index. Indices would likely link their weights to free-float market capitalization, which represents the fraction of a company's shares available for public trading (i.e., excluding restricted shares held by insiders, other strategic investors, etc.).
What’s clear is that index providers are working hard to include these companies in widely tracked indexes sooner rather than later. This has important implications for investors.
When new companies are added to the indexes tracked by an index fund, the fund must quickly acquire shares of those companies to continue closely replicating the index's returns. Anytime there is a set of forced buyers (i.e., index funds) that want shares held by a group of non-forced sellers (i.e., non-index fund investors), there must be an incentive for that transfer to occur.
This can result in index funds paying temporarily inflated prices for new additions to the index they track. This is simply a liquidity issue, but it does negatively impact index funds as they lock in positions at higher prices. Further, adding a company with a large weight means selling others to make room for it, so the rebalancing involves more than just the added company.
For non-index funds, avoiding purchases of companies around the time they are added to popular indexes is expected to add value by steering clear of elevated prices driven by heightened liquidity demands.
Mega-IPOs: Evaluating Fundamentals Beyond the Hype
When large, well-known companies announce their plans to go public, expect to see significant media coverage. These events are newsworthy, especially when they involve companies that are larger than most existing public firms and may introduce new opportunities related to popular investment themes.
As investors, the hype should not stop us from evaluating the merits of these opportunities through a sound framework. If the goal is higher expected returns, we need to consider the full financials of these companies, including their balance sheets and cash flows, as well as their prices.
Whether we are dealing with IPOs or companies that have long traded in the market, those with attractive prices relative to their financials are expected to do better over the long term.
Additionally, strategies that are not strictly tied to indexes can exercise greater flexibility in implementation, whereas index-tracking approaches, by their mandate, are wed to buy-and-sell decisions determined by index houses in their methodology. Flexibility can prove advantageous in these scenarios. We believe all these considerations should be weighed when constructing asset allocations.
Explore More Insights
Glossary
Book Equity-to-Price Ratio:
Measures a company’s fundamental value against its market price, calculated as the ratio of shareholder’s equity to market capitalization. It is also commonly referred to as book-to-price.
Book-to-Market Ratio:
Compares a company’s book value relative to its market capitalization. Book value is generally a firm’s reported assets minus its liabilities on its balance sheet. A firm's market capitalization is calculated by taking its share price and multiplying it by the number of shares it has outstanding.
Expected Returns:
Valuation theory shows that the expected return of a stock is a function of its current price, its book equity (assets minus liabilities) and expected future profits, and that the expected return of a bond is a function of its current yield and its expected capital appreciation (depreciation). We use information in current market prices and company financials to identify differences in expected returns among securities, seeking to overweight securities with higher expected returns based on this current market information. Actual returns may be different than expected returns, and there is no guarantee that the strategy will be successful.
Liquidity:
The degree to which an asset or security can be quickly bought or sold in the market without affecting the asset's price.
Market Capitalization:
The market value of all the equity of a company's common and preferred shares. It is usually estimated by multiplying the stock price by the number of shares for each share class and summing the results.
S&P 500® Index:
A market-capitalization-weighted index of the 500 largest U.S. publicly traded companies. The index is widely regarded as the best gauge of large-cap U.S. equities.
Investment in an IPO can involve heightened risk compared to seasoned securities and include the possible loss of principal.
IPOs typically have a limited operating history, less publicly available information and no established market price prior to the offering.
This may lead to price volatility, especially in early trading and post-IPO due to “lock‑up expirations” that may pressure prices.
References to specific securities are for illustrative purposes only and are not intended as recommendations to purchase or sell securities. Opinions and estimates offered constitute our judgment and, along with other portfolio data, are subject to change without notice.
Investment return and principal value of security investments will fluctuate. The value at the time of redemption may be more or less than the original cost. Past performance is no guarantee of future results.
This material has been prepared for educational purposes only. It is not intended to provide, and should not be relied upon for, investment, accounting, legal or tax advice.
The opinions expressed are those of the investment portfolio team and are no guarantee of the future performance of any Avantis Investors portfolio.