Context Is Key with Market Volatility

Key Takeaways
While volatility has picked up recently, long-term data shows markets have weathered much higher stress before.
Market reactions to current events can feel outsized when viewed without historical context.
A broader lens shows today’s market uncertainty fits within a long pattern of volatility cycles.
On the last Friday in February 2026, the CBOE Volatility Index (VIX) closed at 19.9 — very near its daily average since 1990. The VIX is a popular barometer of the market’s expectations of near-term volatility for U.S stocks. Higher VIX levels indicate higher short-term volatility expectations and a higher cost for insurance against market downturns.
Given the conflict in Iran that began on February 28 and the ensuing market and economic uncertainty, it should come as no surprise that the VIX has reached higher levels on several occasions over the last month. An intra-day high of 35.3 occurred on March 9 — 78% above the February closing level — and the VIX closed above 30 as recently as March 30 before dropping to 25.3 to end the month.
Higher volatility is a reality for investors today, and uncertainty remains about the potential carry-on effects as the conflict in the Middle East continues. However, context is key.
Is Current Market Volatility Unprecedented?
It’s normal for investors to place a higher weight in their minds on what’s happened recently versus what’s occurred in the past. A useful tactic for overcoming this potential psychological bias is to step back and consider today’s events in the broader context.
Let’s consider where the VIX stands today versus history. Figure 1 shows the daily VIX closing and intra-day highs from the start of 1990 through March 2026. The recent rise is evident in the chart, but we also observe many past instances when the VIX reached levels far higher than today. In fact, while the recent volatility should not be glossed over, there are several hundred days since 1990 when the VIX surpassed the March 2026 high of 35.3.
Remarkably, since the start of 2020, expected volatility has risen above recent levels on several occasions, including around the COVID-19 pandemic in 2020, the Russian invasion of Ukraine in 2022, the unwinding of the Yen carry trade in 2024, and U.S. tariff announcements in 2025.
Figure 1 | Volatility Has Risen but Remains Far Below Many Periods in the Past
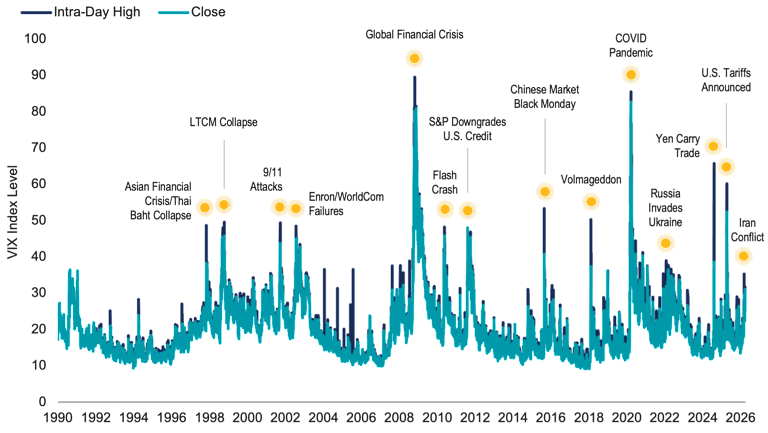
Data from 1/1/1990 – 3/31/2026. Source: CBOE. The VIX Index tracks the expected 30-day future volatility of the S&P 500 Index.
Of course, the VIX is not the only measure garnering attention today. The direction of oil prices, inflation, interest rates, economic growth and more are routinely in the headlines. How do those stack up versus the past?
In Figure 2, we show a broad set of common market and macroeconomic measures, highlighting the latest data versus the highs and lows for each since the start of 2020. As seen previously in the VIX data, the range across the metrics shown has been significant. Current levels remain within the bounds investors have observed in only the past several years.
Even oil and gasoline prices (Panel A), which have elevated meaningfully over the past month, have thus far held below levels reached in 2022 after the Russian invasion of Ukraine, which was followed by severe sanctions on Russian oil. And, while Federal Reserve (Fed) forecasts of March Consumer Price Index (CPI) are higher than prior prints (3.25%), that’s still considerably lower than the highs from 2022. The Fed’s latest forecast of first-quarter gross domestic product (GDP) growth also remains stable at 1.6%.
Figure 2 | Investors Have Faced a Wide Range of Headline Data Since 2020
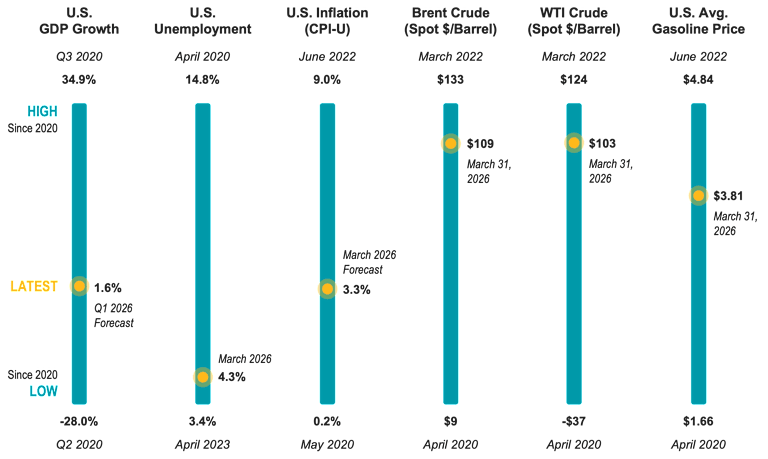
Data from 1/1/2020 – 3/31/2026. GDP Source: U.S. Bureau of Economic Analysis (BEA) and the Federal Reserve Bank of Atlanta’s GDPNow. U.S. Unemployment Source: U.S. Bureau of Labor Statistics (BLS). U.S. Inflation Source: U.S. BLS and the Federal Reserve Bank of Cleveland’s Inflation Nowcasting. Brent Crude, WTI Crude, and U.S. Average Gasoline Price Source: U.S. Energy Information Administration (EIA).
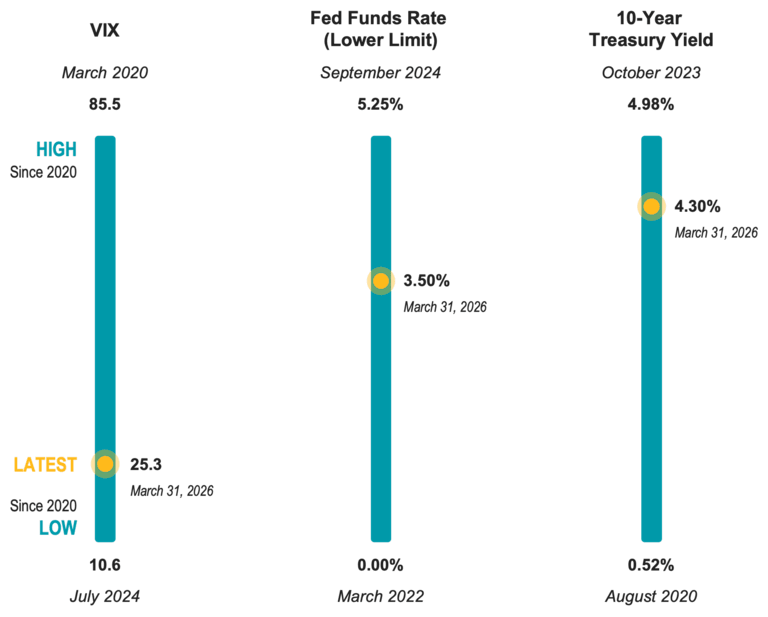
Data from 1/1/2020 – 3/31/2026. VIX Source: CBOE. Fed Funds Rate and 10-Year Treasury Yield Source: Federal Reserve Bank of St. Louis (FRED).
Importantly, despite the dramatic highs and lows in the headline data investors considered over this period, global stock markets have delivered meaningful growth.
There were sizable drawdowns across global markets in early 2020, throughout much of 2022 and in early 2025. For context, the S&P 500® Index was down 5% in March 2026. It declined more than 20% in March 2020 and about 20% in each of 2022 and 2025. Yet, as shown in Figure 3, the S&P 500 is up over 122% (cumulative) since the start of 2020, and global stocks (MSCI ACWI IMI) also gained nearly 90% in USD.
Figure 3 | Periods of Heightened Volatility Since 2020 Have Not Prevented Growth from Global Stocks
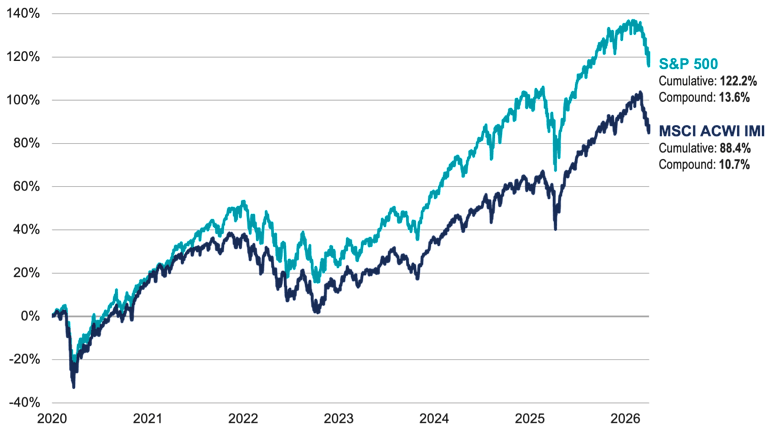
Data from 1/1/2020 – 3/31/2026. Source: Morningstar. Past performance is no guarantee of future results.
Taken together, the data presented provides a few important takeaways.
While uncertainty is high today, where we stand on most popular measures of the market and economy is not outside what we’ve seen during separate periods in just the last six years.
While the conflict in Iran continues, it’s unknown how high or low the headline metrics or market returns will go in the near term. With that said, we believe investors can benefit from remembering that a headline about a single measure, such as oil prices spiking or inflation estimates “rattling” markets, is always better with more context.
While each market downturn will have its own unique characteristics, investors may find comfort in knowing that many of the oft-cited measures have not reached recent past extremes. Importantly, those extremes are periods investors have recently faced, and for those who endured, global stock markets have delivered strong results.
Explore More Insights
Glossary
Brent Crude
The most-traded of the three major oil benchmarks used by those trading oil contracts, futures and derivatives. Brent crude is mainly drilled from the North Sea.
Volatility indexes are forward-looking measures of the market's expectations of volatility (or how much a stock index's price moves). The CBOE manages and publishes three of the most widely used volatility indexes based on three major stock indexes: The VIX Index tracks the expected 30-day future volatility of the S&P 500 Index, the VXN Index tracks the expected 30-day future volatility of the NASDAQ-100 Index and the VXD Index tracks the expected 30-day future volatility of the Dow Jones Industrial Average Index. VIX, VXN and VXD are the ticker symbols for these three volatility indexes. The VIX in particular is a widely used measure of market risk and is often referred to as the "investor fear gauge."
Commodities are raw materials or primary agricultural products that can be bought or sold on an exchange or market. Examples include grains such as corn, foods such as coffee, and metals such as copper.
CPI is the most commonly used statistic to measure inflation in the U.S. economy. Sometimes referred to as headline CPI, it reflects price changes from the consumer's perspective. It's a U.S. government (Bureau of Labor Statistics) index derived from detailed consumer spending information. Changes in CPI measure price changes in a market basket of consumer goods and services such as gas, food, clothing, and cars. Core CPI excludes food and energy prices, which tend to be volatile.
The federal funds rate is an overnight interest rate banks charge each other for loans. More specifically, it's the interest rate charged by banks with excess reserves at a Federal Reserve district bank to banks needing overnight loans to meet reserve requirements. It's an interest rate that's mentioned frequently within the context of the Federal Reserve's interest rate policies. The Federal Reserve's Open Market Committee (defined below) sets a target for the federal funds rate (which is a key benchmark for all short-term interest rates, especially in the money markets), which it then supports/strives for with its open market operations (buying or selling government securities).
The Fed is the U.S. central bank, responsible for monetary policies affecting the U.S. financial system and the economy.
A measure of the total economic output in goods and services for an economy.
The MSCI ACW (All Country World) Investable Market Index (IMI) captures large, mid and small cap representation across 23 Developed Markets (DM) and 24 Emerging Markets (EM) countries. With 9,139 constituents, the index is comprehensive, covering approximately 99% of the global equity investment opportunity set.
A market-capitalization-weighted index of the 500 largest U.S. publicly traded companies. The index is widely regarded as the best gauge of large-cap U.S. equities.
The yield (defined below) of a Treasury security (most often refers to U.S. Treasury securities issued by the U.S. government).
West Texas Intermediate (WTI) Crude
A crude stream produced in Texas and southern Oklahoma, which serves as a reference for pricing a number of other crude streams. One of the three major oil benchmarks used by those trading oil contracts, futures and derivatives.
For bonds and other fixed-income securities, yield is a rate of return on those securities. There are several types of yields and yield calculations. "Yield to maturity" is a common calculation for fixed-income securities, which takes into account total annual interest payments, the purchase price, the redemption value, and the amount of time remaining until maturity.
Investment return and principal value of security investments will fluctuate. The value at the time of redemption may be more or less than the original cost. Past performance is no guarantee of future results.
This material has been prepared for educational purposes only. It is not intended to provide, and should not be relied upon for, investment, accounting, legal or tax advice.
The opinions expressed are those of the investment portfolio team and are no guarantee of the future performance of any Avantis Investors portfolio.