
Inflation Alphabet Soup: CPI, PCE and Shifting Rate Expectations

Key Takeaways
Markets have shifted from expecting rate cuts to anticipating rate hikes as inflation remains above the Fed’s long-term target.
CPI and PCE are closely watched inflation gauges, but they capture price changes using distinct methodologies and weights.
Looking beyond headline inflation can reveal important trends across housing, energy, health care and other consumer spending categories.
One of the most notable developments from the July Federal Open Market Committee (FOMC) meeting was not the decision to leave interest rates unchanged, but the rare split behind it. Three bank presidents dissented in favor of a quarter-point rate hike, marking the first time since 2016 that three members broke with the committee's decision.
The unusually divided vote underscores growing disagreement over how to respond to persistent price pressures. Both the Federal Reserve (Fed) and financial markets are also weighing renewed geopolitical tensions in the Middle East and their potential impact on prices, particularly in the energy sector.
In response, markets continue to price in a rate hike at the September meeting with the potential for additional tightening going forward, as highlighted by Figure 1. This stands in contrast to the beginning of the year, when investors anticipated a series of rate cuts as inflation appeared to be moving closer to the Fed's target.
Figure 1 | Markets Are Pricing in at Least One Rate Hike in 2026
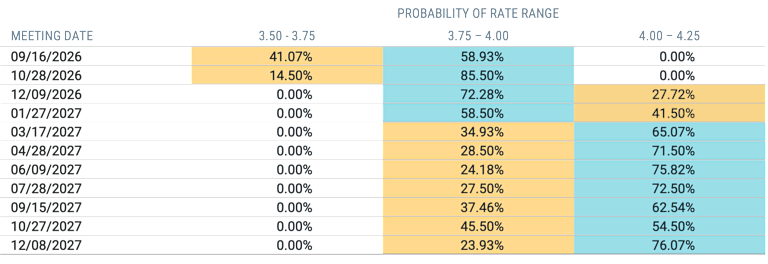
Data as of 8/4/2026. Source: CME FedWatch. The FedWatch tool's "Aggregated" view compares the rates implied by CME's Fed Funds futures with the Federal Reserve's current target rate range. As such, it provides a view into the cumulative number of hikes or cuts the market is pricing in by a certain point in the future.
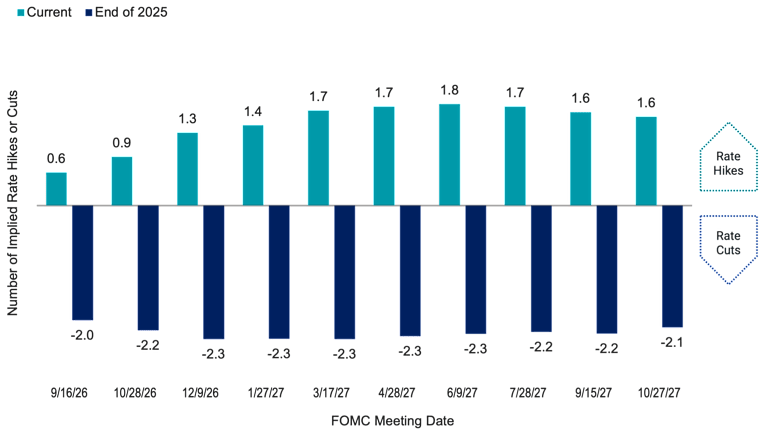
Data as of 8/4/2026. End of 2025 data as of 12/31/2025. Source: Bloomberg, Avantis Investors.
While the relationship between inflation and interest rates may seem straightforward, inflation isn’t a single number, and different measures can paint different pictures of underlying price movements.
To better understand these differences, we take a closer look at the indexes that policymakers and market participants watch most closely.
What Is the Difference Between CPI and PCE?
The Consumer Price Index (CPI) and the Personal Consumption Expenditures (PCE) price index are the two most widely followed measures of inflation in the U.S. Both are designed to capture changes in consumer prices by tracking the cost of a basket of goods and services.
Despite that shared goal, they differ in important ways, including their coverage, underlying category weights and the degree of revision. Figure 2 provides a closer look at these differences.
A few things stand out in the comparison. CPI receives significant investor attention, largely because it’s released before PCE and because it contains much of the same price information that ultimately feeds into PCE. However, the Fed has preferred PCE since 2000 and defines its longer-run 2% inflation goal using the annual change in the core PCE price index.
Figure 2 | CPI vs. PCE: How the Two Inflation Gauges Differ
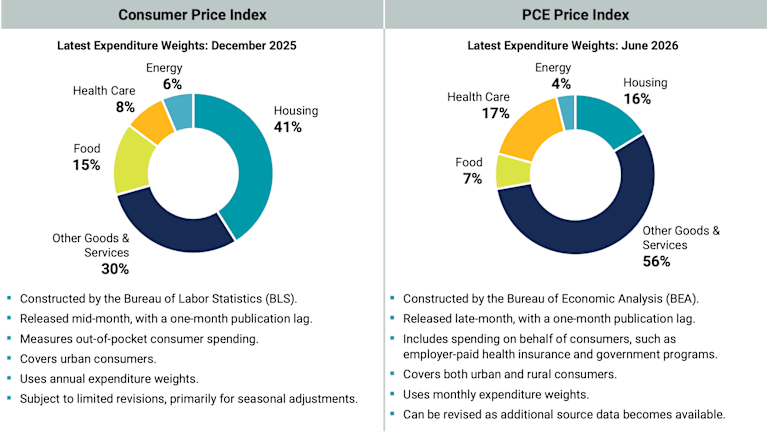
Source: U.S. Bureau of Labor Statistics, Bureau of Economic Analysis, and Avantis Investors.
The Fed’s preference for PCE reflects several features of the index. PCE covers a broader set of goods and services, including spending made on behalf of consumers. The index also better reflects changes in consumer spending patterns over time because category weights are dynamic and updated monthly.
For example, if high beef prices prompt consumers to switch to chicken, the PCE index will reflect that shift more quickly than CPI, which resets weights annually. PCE also includes both urban and rural consumers, whereas CPI focuses on urban consumers.
The category weights shown in Figure 2 also help explain why CPI and PCE can tell somewhat different stories at a given point in time. CPI places far greater emphasis on housing costs, while PCE gives more weight to health care. The difference stems largely from PCE's broader coverage, which includes health care spending on behalf of consumers through programs such as Medicare and Medicaid, as well as employer-provided health insurance.
Because CPI focuses more directly on out-of-pocket consumer spending, housing accounts for a larger share of the index. As a result, the gap between CPI and PCE may reflect where price changes are most concentrated. Increases in housing costs tend to have a larger effect on CPI, whereas increases in health care costs tend to have a greater effect on PCE.
How Is Core Inflation Different From Headline Inflation?
Both CPI and PCE have "core" versions that exclude food and energy, as these categories tend to be more volatile and can fluctuate for reasons unrelated to broader inflation trends. Figure 3 compares the price movements of headline CPI with its underlying categories by reindexing each measure to 100 in December 2019.
Figure 3 | Under Headline CPI, Consumer Prices Can Vary Greatly
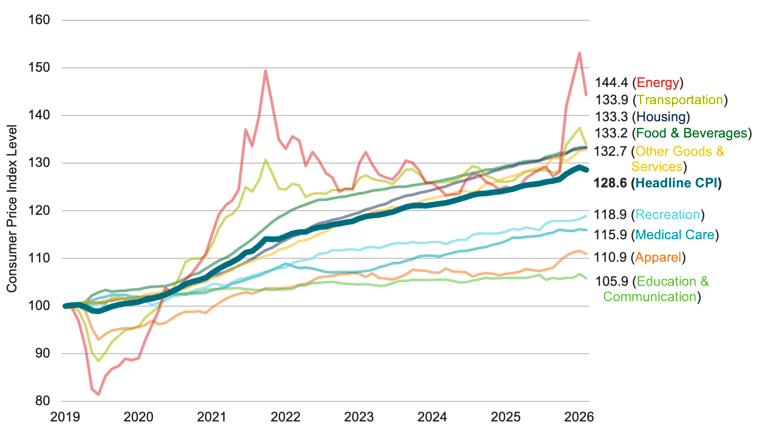
Data from 12/31/2019–6/30/2026. Data indexed to 100 beginning 12/31/2019. Source: U.S. Bureau of Labor Statistics, Avantis Investors.
Although headline CPI increased by 28.6% since 2019, price growth varied considerably across categories.
We break out energy as a separate series to highlight its volatility. In headline CPI, energy services, such as utilities, are primarily included within housing, while energy commodities, such as gasoline, are included within transportation. Isolated from the rest, energy prices charted a far bumpier course than headline CPI: energy experienced larger fluctuations over time than most other major categories, and the series finished 44.4% above its level in December 2019. This volatility helps explain why economists often focus on core inflation measures when assessing underlying price trends.
Interestingly, food prices didn’t show the same degree of volatility as energy prices over the period. This distinction has become part of the broader conversation around how best to measure core inflation. Recent research from the St. Louis Fed suggested an alternative core PCE measure that excludes only energy goods rather than both food and energy.
The formulas for these measures have changed before and are likely to change again. In fact, the upcoming September release of core PCE will include adjustments the BEA is making to its measurement of the cost of software, legal services and investment management.1
While we can’t predict exactly how these measures will evolve or how the Fed will use them, it’s important to remember that a single measure may not tell the full story. Beneath headline inflation numbers, price changes can vary meaningfully across categories.
How Closely Do CPI and PCE Track Each Other?
Given the differences we’ve discussed between CPI and PCE, it is reasonable to expect the two indexes to diverge at times. Figure 4 compares 12-month core CPI and 12-month core PCE to show how the measures have behaved relative to one another over time.
Panel A focuses on the past five years, including the high-inflation period in 2021 and 2022. While the two measures generally move in the same direction, we can see that gaps may emerge over shorter periods. For example, core PCE has remained elevated recently even as core CPI has shown signs of cooling.
Panel B zooms out to provide a long-term perspective. Although CPI and PCE are not perfectly aligned, they have tracked each other closely over time and tend to signal similar inflation trends. As a result, temporary gaps between the two measures are often less important than the broader message they convey about the direction and persistence of inflation.
Figure 4 | Despite Differences, CPI and PCE Signal Similar Inflation Trends
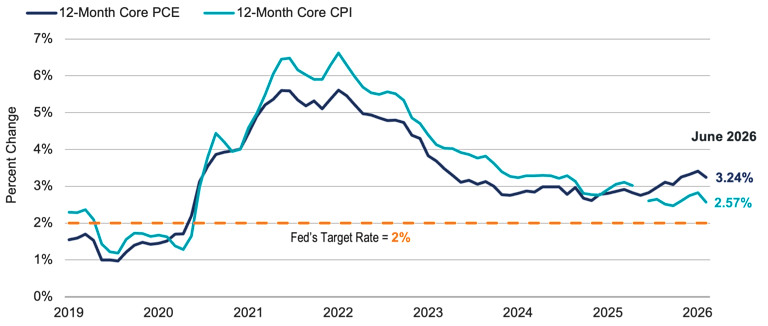
Data from 12/31/2019–6/30/2026. Source: U.S. BEA, U.S. BLS, Avantis Investors.
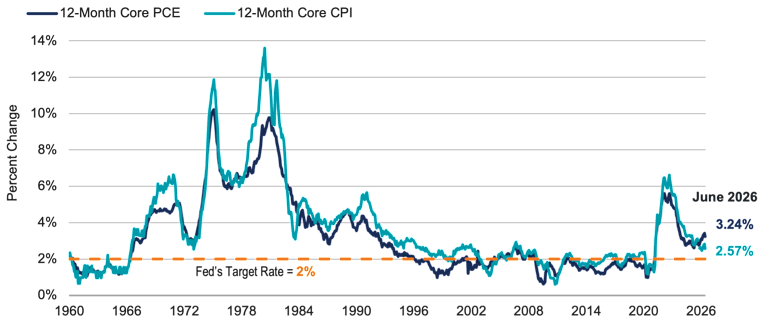
Data from 1/1/1960–6/30/2026. Source: U.S. BEA, U.S. BLS, Avantis Investors.
What Can Inflation Measures Tell Us About Long-Term Investing?
Regardless of how it’s measured, inflation erodes purchasing power. For long-term investors, the question then becomes how to build portfolios that can grow wealth at a rate exceeding inflation over time.
Figure 5 compares the growth of $1 invested in the U.S. stock market and one-month Treasury bills since 1947 alongside the cumulative rise in prices over the same period, as measured by the CPI.
Figure 5 | Long-Term Investments Have Historically Outpaced Inflation
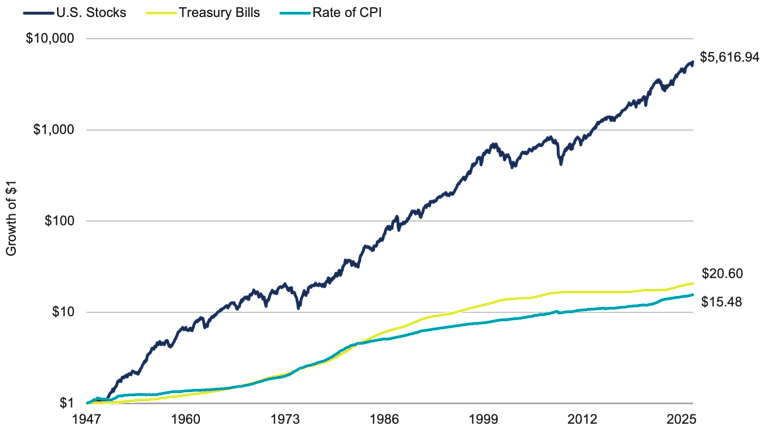
Data from 1/1/1947–6/1/2026. Source: Bureau of Labor Statistics, Ken French Data Library, and Avantis Investors. Past performance is no guarantee of future results.
Consumer prices have risen to more than 15 times their 1947 level, meaning $1 would need to grow to about $15.48 just to maintain its purchasing power. By contrast, $1 invested in the U.S. stock market has grown to more than $5,600. That’s great news for investors: While inflation is a real risk, history suggests that disciplined investing can be an effective tool for overcoming it.
The main takeaway isn’t that investors should ignore inflation. On the contrary, inflation matters, and it’s reasonable to pay attention to how it is measured and how it may influence monetary policy.
At the same time, periods of higher inflation don’t need to be a reason to abandon long-term discipline. Instead, finding an asset allocation you can stick with, embracing diversification, and using tax- and cost-efficient investment strategies can help stack the odds in your favor toward achieving a positive long-term investment experience.
Explore More Insights
Matt Grossman, “A Statistical Revamp Is About to Lower Inflation, at a Critical Time,” Wall Street Journal, July 19, 2026.
Glossary:
Commodities are raw materials or primary agricultural products that can be bought or sold on an exchange or market. Examples include grains such as corn, foods such as coffee, and metals such as copper.
CPI is the most commonly used statistic to measure inflation in the U.S. economy. Sometimes referred to as headline CPI, it reflects price changes from the consumer's perspective. It's a U.S. government (Bureau of Labor Statistics) index derived from detailed consumer spending information. Changes in CPI measure price changes in a market basket of consumer goods and services such as gas, food, clothing, and cars. Core CPI excludes food and energy prices, which tend to be volatile.
The federal funds rate is an overnight interest rate banks charge each other for loans. More specifically, it's the interest rate charged by banks with excess reserves at a Federal Reserve district bank to banks needing overnight loans to meet reserve requirements. It's an interest rate that's mentioned frequently within the context of the Federal Reserve's interest rate policies. The Federal Reserve's Open Market Committee (defined below) sets a target for the federal funds rate (which is a key benchmark for all short-term interest rates, especially in the money markets), which it then supports/strives for with its open market operations (buying or selling government securities).
Federal Open Market Committee (FOMC) is the committee that sets interest rate and credit policies for the Federal Reserve System, the U.S. central bank. The committee decides whether to increase or decrease interest rates through open-market operations of buying or selling government securities. The committee normally meets about eight times per year.
The Fed is the U.S. central bank, responsible for monetary policies affecting the U.S. financial system and the economy.
The personal consumption expenditures ("PCE") price deflator—which comes from the Bureau of Economic Analysis' quarterly report on U.S. gross domestic product—is based on a survey of businesses and is intended to capture the price changes in all final goods, no matter the purchaser. Because of its broader scope and certain differences in the methodology used to calculate the PCE price index, the Federal Reserve ("the Fed") holds the PCE deflator as its preferred, consistent measure of inflation over time.
Debt securities issued by the U.S. Treasury and backed by the direct "full faith and credit" pledge of the U.S. government. Treasury securities include bills (maturing in one year or less), notes (maturing in two to 10 years) and bonds (maturing in more than 10 years). They are generally considered among the highest quality and most liquid securities in the world.
Investment return and principal value of security investments will fluctuate. The value at the time of redemption may be more or less than the original cost. Past performance is no guarantee of future results.
This information is for educational purposes only and is not intended as tax advice. Please consult your tax advisor for more detailed information or for advice regarding your individual situation.
Portfolio holdings are as of date indicated and subject to change.
It is not possible to invest directly in an index.
The opinions expressed are those of the investment portfolio team and are no guarantee of the future performance of any Avantis Investors portfolio.
References to specific securities are for illustrative purposes only and are not intended as recommendations to purchase or sell securities. Opinions and estimates offered constitute our judgment and, along with other portfolio data, are subject to change without notice.