
When Safety Becomes a Risk

Key Takeaways
Holding more cash may feel safer during uncertain markets, yet the costs often emerge gradually through inflation and forgone growth.
The long-term effects of holding additional cash can become more pronounced as investment horizons extend across decades.
The question may not be whether investors should hold cash, but how much cash aligns with their specific financial goals.
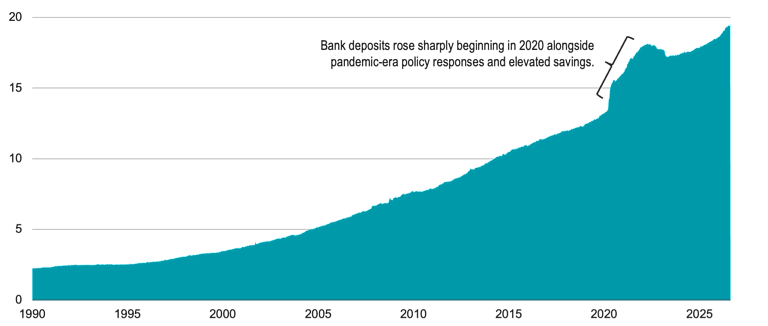
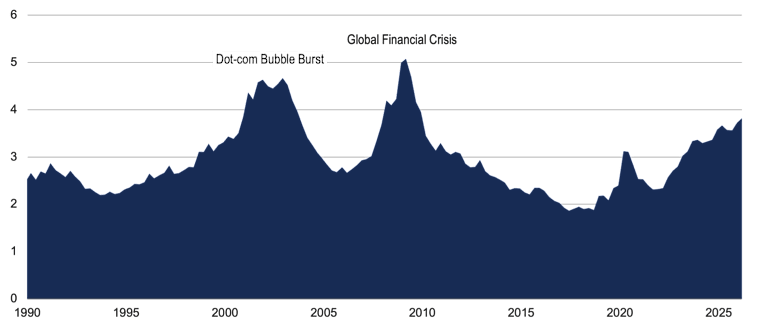
Cash balances have risen for many investors this year, whether measured by bank deposits or by money market funds as a share of assets, as shown in Figure 1. This has occurred amid heightened geopolitical tensions, including the war in Iran and the risk that it becomes a prolonged conflict. That possibility has renewed concerns about inflation, as the effects of the pandemic-era inflation spike remain fresh in investors' minds.
Adding to the uncertainty, opinions on how much artificial intelligence (AI) will reshape economies are as varied as those surrounding any previous technological revolution.
Figure 1 | Cash Holdings Have Increased
Source: Federal Reserve.
Notes: U.S. commercial bank deposits are shown weekly from January 3, 1990, through August 19, 2026. U.S. money market fund holdings, expressed as a percentage of total household financial assets, are shown quarterly from Q1 1990 through Q1 2026.
Past performance is no guarantee of future results.
If volatility is a primary concern, the appeal of cash is understandable. Equities and higher-yielding bonds can experience meaningful drawdowns during periods of market stress, while cash yields are more attractive now than they have been for much of the past two decades.
But like much in investing, and frankly, in life, the decision comes with trade-offs. By allocating more to cash, investors reduce their exposure to assets that fluctuate more, which can help dampen portfolio volatility. At the same time, they reduce their exposure to assets that have historically generated higher long-term returns. In other words, raising cash levels in a portfolio doesn’t reduce the risk an investor faces. It simply changes it.
The consequences of holding too much cash often emerge gradually through inflation, lower long-term returns, or the possibility that assets fail to grow sufficiently to support future spending needs. These costs rarely arrive as a dramatic headline or a sudden market decline. Instead, they accumulate quietly over time. Yet over long investment horizons, they can be just as consequential, if not more so.
What Is the Long-Term Cost of Holding More Cash?
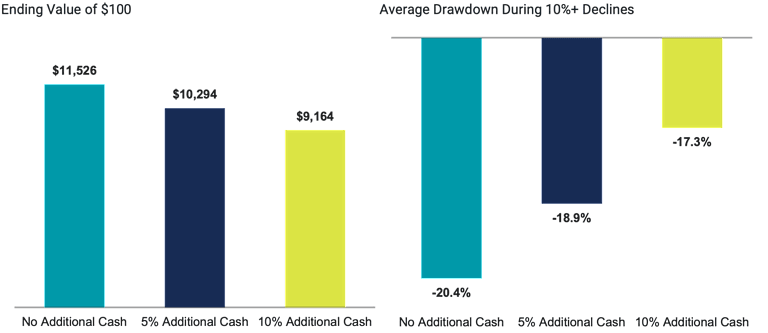
To explore this trade-off, consider a traditional portfolio of 70% global equities and 30% U.S. bonds, a risk profile common among U.S. investors. Since 1970, an investor in this portfolio would have accumulated approximately 26% more wealth than an investor who shifted 10% of the portfolio from equities to cash (60% equities, 30% bonds and 10% cash), as shown in Figure 2. The result illustrates how long investment horizons can amplify the effects of small differences in expected returns.
Figure 2 | The Long-Term Trade-Off of Holding Additional Cash
Sources: Morningstar, MSCI, Bloomberg and Federal Reserve. Past performance is no guarantee of future results.
Notes: Drawdowns are calculated using month-end returns and measured as the percentage decline from each portfolio's previous peak value. Portfolios consist of (1) 70% global equities, 30% U.S. bonds and 0% cash; (2) 65% global equities, 30% U.S. bonds and 5% cash; and (3) 60% global equities, 30% U.S. bonds and 10% cash. Allocations remain constant throughout the analysis. Average drawdown is calculated using the maximum drawdown observed during each 70/30 portfolio drawdown episode of 10% or greater. The month-end dates corresponding to these drawdown troughs are June 1970, September 1974, September 1981, November 1987, September 1990, September 2002, February 2009, September 2011, March 2020 and September 2022. Global equities represented by the MSCI ACWI Index, using the MSCI World Index for periods prior to 2001. U.S. bonds represented by the Bloomberg U.S. Aggregate Bond Index, using 10-Year U.S. Treasury returns prior to 1973. Cash represented by U.S. Treasury bills.
That higher ending wealth was accompanied by somewhat larger fluctuations in portfolio value. Over the full period, the 70/30 portfolio had an annualized standard deviation of 11%, compared with 9% for the portfolio with an additional 10% allocation to cash.
The difference was also evident during market declines. During the Global Financial Crisis, which represented the largest drawdown difference observed in the sample, the 70/30 portfolio's maximum drawdown was approximately 5 percentage points higher than that of the portfolio with an additional 10% allocation to cash. Across all major drawdowns, the difference averaged approximately 3 percentage points.
The difference exists because cash and equities represent fundamentally different economic claims. Cash generally earns a short-term interest rate, while equities represent ownership in businesses whose earnings can grow over time.1 As those businesses reinvest, innovate and expand, investors participate in that growth through higher earnings, dividends and stock prices.
Over long periods, even modest differences in returns can lead to substantial differences in wealth because each year's gains create a larger base on which future gains can compound. As a result, the performance gap between equities and cash tends to widen over time.
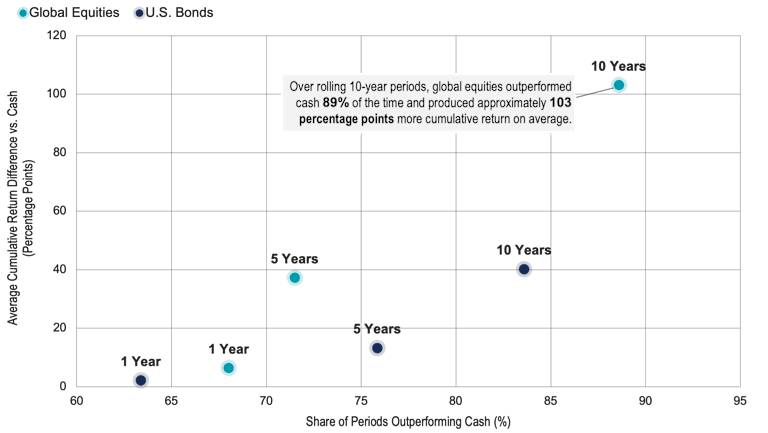
The historical record supports this idea. Over time, both equities and bonds have outperformed cash more often than not, even over relatively short investment horizons. As holding periods have lengthened, that advantage has generally become both more likely and more pronounced.
For instance, global equities outperformed cash in 68% of rolling one-year periods, 72% of rolling five-year periods and 89% of rolling 10-year periods, as shown in Figure 3. While the magnitude has varied across markets, currencies and time periods, the pattern itself has remained remarkably consistent.
Figure 3 | The Historical Advantage of Equities and Bonds Over Cash Has Been Greater in Longer Holding Periods
Sources: Morningstar, MSCI, Bloomberg and Federal Reserve. Past performance is no guarantee of future results.
Notes: Each observation shows, for the indicated rolling investment horizon, the average cumulative return of global equities or U.S. bonds relative to U.S. cash and the percentage of periods in which the asset outperformed cash. Global equities represented by the MSCI ACWI Index, using the MSCI World Index for periods prior to 2001. U.S. bonds represented by the Bloomberg U.S. Aggregate Bond Index, using 10-Year U.S. Treasury returns prior to 1973. Cash is represented by U.S. Treasury bills.
If the historical evidence is so persistent, why do many investors continue to increase cash allocations during periods of uncertainty?
Part of the answer is behavioral. Investors don’t experience all risks equally. A market decline is immediately visible. It appears on account statements, dominates financial headlines and often generates a strong emotional response.
By contrast, the costs of holding excess cash are rarely observed directly. Few investors receive a statement showing the wealth that could have been accumulated had a different allocation decision been made. As a result, the benefits of holding cash often feel tangible and immediate, while the associated costs remain abstract and deferred to the future.
This can make actions that reduce short-term anxiety seem prudent, even when they reduce the likelihood of achieving long-term goals. In fact, because many investors are uncomfortable with uncertainty, riskier assets have historically needed to offer higher expected returns to attract capital.
When Does Holding Cash Make Sense?
None of this suggests that investors should avoid cash entirely. For near-term spending needs, such as an upcoming home purchase or other planned expenditures, keeping higher cash balances can be appropriate and prudent. Cash provides flexibility and can reduce the likelihood of being forced to sell long-term investments in unfavorable market conditions.
Determining how much cash to hold is an important part of financial planning. Advisors routinely help clients evaluate upcoming liabilities, liquidity needs, tax considerations and sources of future spending. In some cases, maintaining dedicated cash reserves may be appropriate. In others, future spending can be funded through ongoing portfolio management, such as rebalancing, tax-loss harvesting or selling appreciated assets as needed.
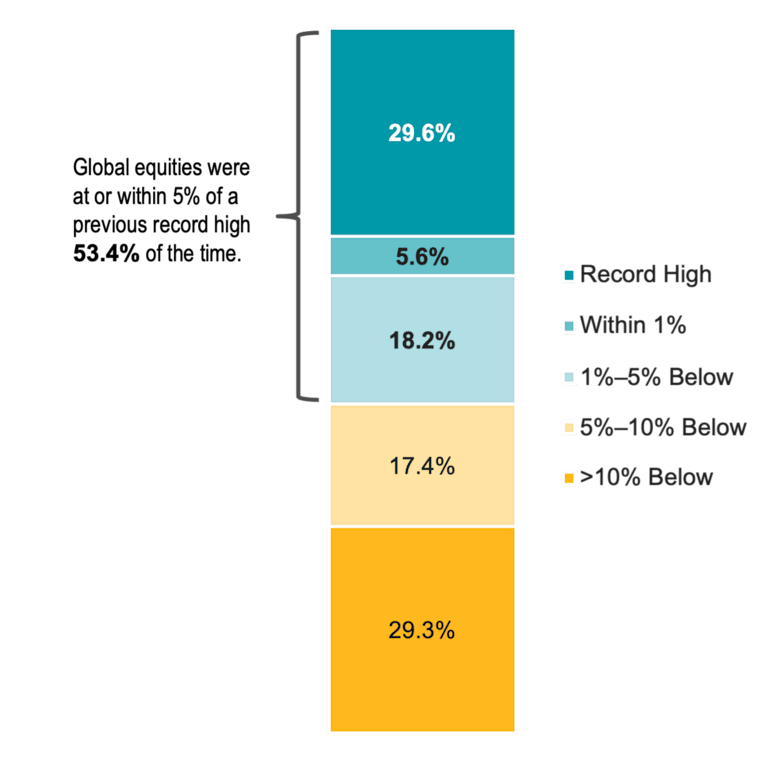
Investors are often tempted to increase cash balances when markets are at or near record highs. Yet such periods are a normal feature of long-term investing and, on their own, provide little guidance about future returns, as illustrated in Figure 4. As a result, future spending needs don’t always require maintaining large cash reserves years in advance.
For investors waiting on the sidelines for “the right” buying opportunity, it’s worth remembering that history shows further gains have often followed all-time highs. In our view, the goal is neither to maximize nor minimize cash balances, but to align them with the purpose they are intended to serve.
Ultimately, the decision isn’t about avoiding risk but about choosing which risks to bear. In that sense, the greatest danger may not be market volatility itself but the sacrifice of long-term objectives in pursuit of short-term comfort.
Figure 4 | Global Equities Have Often Been Near Record Highs
Sources: Morningstar and MSCI. Past performance is no guarantee of future results.
Notes: Each month-end observation was classified based on its proximity to the previous record high. Percentages show the share of observations in each category over the sample period. Global equities represented by the MSCI ACWI Index, using the MSCI World Index for periods prior to 2001.
Explore More Insights
The term cash is used broadly to include bank deposits, money market funds, U.S. Treasury bills and other cash-equivalent investments.
Glossary:
Represents securities that are taxable, registered with the Securities and Exchange Commission, and U.S. dollar-denominated. The index covers the U.S. investment-grade fixed-rate bond market, with index components for government and corporate securities, mortgage pass-through securities, and asset-backed securities.
A payment of a company's earnings to stockholders as a distribution of profits.
Expected Returns: Valuation theory shows that the expected return of a stock is a function of its current price, its book equity (assets minus liabilities) and expected future profits, and that the expected return of a bond is a function of its current yield and its expected capital appreciation (depreciation). We use information in current market prices and company financials to identify differences in expected returns among securities, seeking to overweight securities with higher expected returns based on this current market information. Actual returns may be different than expected returns, and there is no guarantee that the strategy will be successful.
High-yield bonds are fixed income securities with lower credit quality and lower credit ratings. High-yield securities are those rated below BBB- by Standard & Poor's.
Liquidity describes the degree to which an asset or security can be quickly bought or sold in the market without affecting the asset's price.
Short-term debt instruments (such as certificates of deposit, commercial paper, Treasury bills, banker's acceptances, and repurchase agreements) that are valued for their relative safety and liquidity.
MSCI ACWI Index:
A capitalization-weighted index that is designed to measure the equity market performance of developed and emerging markets.
Standard deviation is a statistical measurement of variations from the average. In financial literature, it's often used to measure risk, when risk is measured or defined in terms of volatility. In general, more risk means more volatility, and more volatility means a higher standard deviation—there's more variation from the average of the data being measured. In this context, reducing risk means seeking lower standard deviation.
Debt securities issued by the U.S. Treasury and backed by the direct "full faith and credit" pledge of the U.S. government. Treasury securities include bills (maturing in one year or less), notes (maturing in two to 10 years) and bonds (maturing in more than 10 years). They are generally considered among the highest quality and most liquid securities in the world.
For bonds and other fixed-income securities, yield is a rate of return on those securities. There are several types of yields and yield calculations. "Yield to maturity" is a common calculation for fixed-income securities, which takes into account total annual interest payments, the purchase price, the redemption value, and the amount of time remaining until maturity.
Investment return and principal value of security investments will fluctuate. The value at the time of redemption may be more or less than the original cost. Past performance is no guarantee of future results.
This material has been prepared for educational purposes only. It is not intended to provide, and should not be relied upon for, investment, accounting, legal or tax advice.
The opinions expressed are those of the investment portfolio team and are no guarantee of the future performance of any Avantis Investors portfolio.