
The Price of Capital

Key Takeaways
The price of capital has risen as global yields move higher and investors demand greater compensation for lending money.
Persistent deficits and growing investment in AI-related infrastructure may be contributing to stronger demand for capital.
Bonus: History suggests elections may matter less for long-term stock returns than many investors assume.
For much of the post-financial-crisis era, some investors worried that the world had too much capital and too few productive uses for it. Interest rates hovered near historic lows across developed markets, governments borrowed cheaply, and companies could finance ambitious projects at modest cost. An investment challenge of that era was determining how to invest in a world with easy access to capital.
Today, the environment looks different. Government bond yields have risen sharply in recent years and moved higher again over the past month, with several countries approaching or exceeding post-pandemic highs, as shown in Figure 1. Inflation and central bank policy have clearly contributed to this move, but they may not be the only factors influencing yields.
Figure 1 | Global Sovereign Bond Yields Are Near Multi-Decade Highs
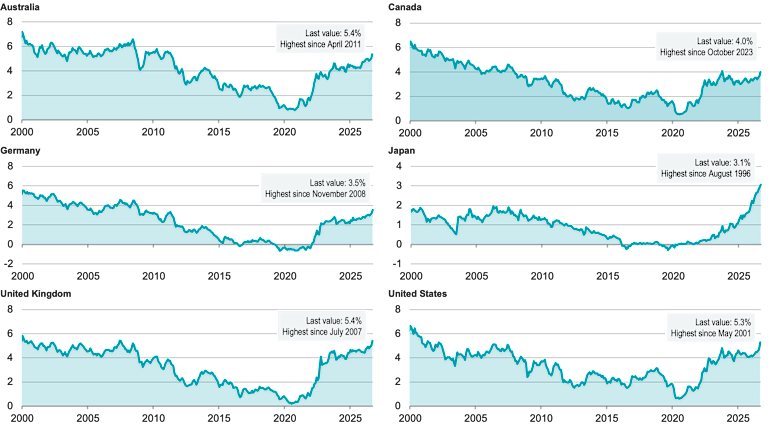
Sources: FactSet and Organisation for Economic Co-operation and Development.
Notes: Data reflect OECD’s monthly average 10-year constant maturity government bond yields. Last data point of each series reflect FactSet month-end data.
At its core, an interest rate is the price of capital, balancing the willingness of investors to supply capital with the demand for investment and financing. Viewed through this lens, the recent rise in yields may represent more than a shift in inflation or monetary policy. It may reflect stronger demand for capital, less willingness to supply that capital, or some combination of the two.
Of course, the future path of yields remains uncertain. What is less uncertain is that a higher cost of capital raises the returns investors require from both fixed income and equities.
Why Competition for Capital Is Increasing
Inflation remains an important part of the discussion surrounding higher yields. One reason inflation does not fully explain the rise in yields is that bond yields reflect both expected inflation and the return investors receive above inflation, known as the real yield. Across many developed markets, much of the recent increase in yields has come from higher real yields rather than higher inflation expectations. While higher energy prices linked to the war in Iran have raised near-term inflation concerns, longer-term inflation expectations have remained relatively stable, suggesting investors continue to view central banks as capable of preventing the energy shock from becoming persistent inflation.
Higher real yields have coincided with elevated government demand for capital. Fiscal deficits remain elevated across much of the developed world, adding to debt burdens that have accumulated over many years. As shown in Figure 2, U.S. federal spending exceeds tax revenue by roughly 6% of gross domestic product (GDP) and is projected to remain so for the foreseeable future. Meanwhile, debt issued during years of exceptionally low interest rates is increasingly refinanced at higher borrowing costs, pushing annual interest expense to nearly 4% of GDP. The combination of persistent deficits and rising interest costs has increased governments' need for capital across much of the developed world.
Figure 2 | U.S. Federal Budget Gap Is Expected to Persist
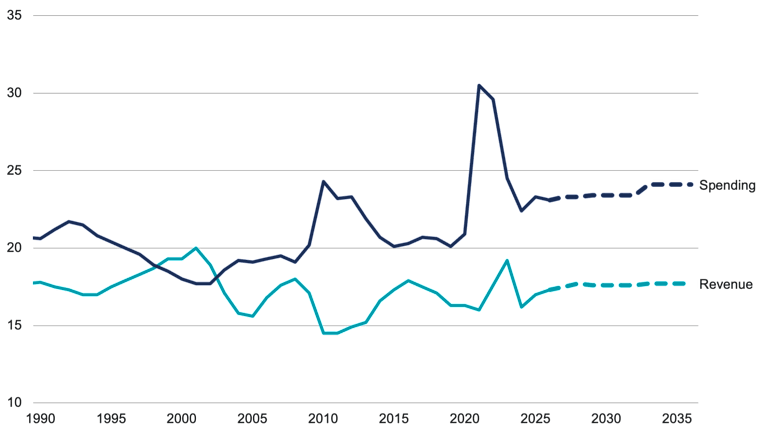
Notes: Federal revenue and spending are shown as a percentage of U.S. GDP. Historical data through 2025 are from the Office of Management and Budget. Projections for 2026-2035 are from the Congressional Budget Office. Dashed lines indicate projected values.
Yields may also be reacting partly to expectations of private-sector demand. Artificial intelligence (AI) has triggered one of the largest technology investment cycles in decades, with its promise to improve productivity. Capital expenditures among five major hyperscalers — Alphabet, Amazon, Meta, Microsoft, and Oracle — have risen dramatically and are projected to continue increasing in the coming years. Aggregate capital expenditures have grown from less than $100 billion in 2020 to nearly $700 billion in 2026. Importantly, these figures do not fully capture the scale of the buildout.
A significant increase in AI adoption would require additional investment across large parts of the economy. Figure 3 illustrates one example, showing that data center electricity consumption is projected to more than double over the next decade under the U.S. government's base-case forecast. Meeting that demand would involve investment in power generation, transmission networks, substations, cooling systems, and other physical infrastructure. These projections illustrate how hyperscaler spending could contribute to a broader demand for capital.
Figure 3 | Data-Center Growth Is Increasing Demand for Power Infrastructure
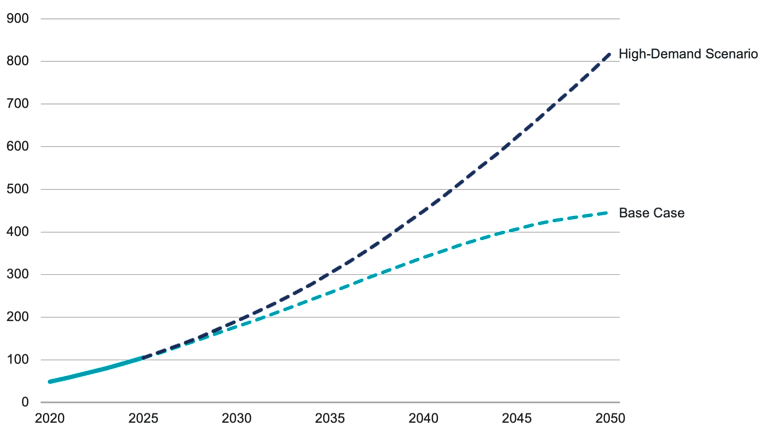
Source: U.S. Energy Information Administration.
Notes: Historical and projected U.S. commercial data-center server electricity consumption is shown in billion kilowatt-hours. The dashed lines are projections and represent the reference case and high electricity demand cases. Data are from the Annual Energy Outlook 2026, released in April.
Individually, none of these developments fully explains the rise in yields. Collectively, they illustrate how governments, businesses, and infrastructure projects may make larger claims on global savings at the same time. Because interest rates help balance the supply of savings with the demand for financing, these developments provide a useful framework for understanding the higher cost of capital.
How Higher Capital Costs Have Affected Market Returns
A higher price of capital is not necessarily negative for equity markets. While yields are higher than they were for much of the post-financial-crisis period, many remain below their long-term historical averages, including the benchmark U.S. 10-year Treasury note. Investors have navigated both higher- and lower-rate environments over time, and equity markets have generated substantial long-term growth in both. Historical evidence can nevertheless provide some context for thinking about today's environment.
One perspective on how different types of companies have performed across interest-rate environments is shown in Figure 4. It divides the full historical sample into periods of either rising yields or falling yields and compares the returns of more attractively priced, more profitable U.S. companies with those of less attractively priced, less profitable companies. The more profitable, attractively priced group outperformed in both environments, as would be expected, and the return difference was larger when yields rose. These results suggest that disciplined attention to profitability and valuation has been rewarded in both rising- and falling-yield environments.
Figure 4 | Returns to Profitability and Valuation Have Persisted Across Yield Environments
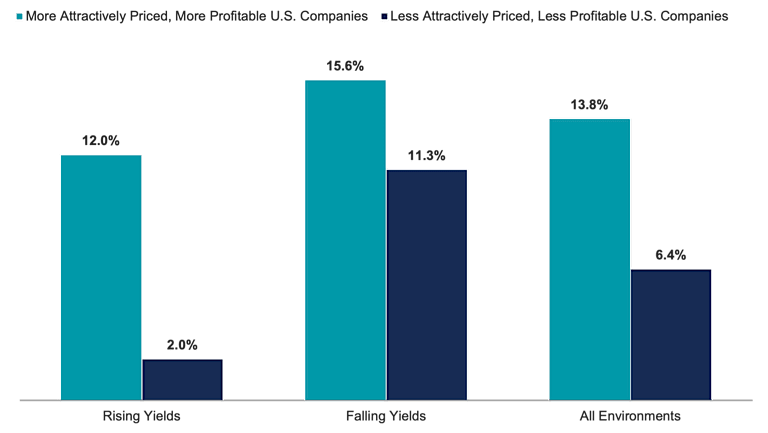
Sources: Kenneth R. French Data Library, Federal Reserve Bank of St. Louis (FRED), and Avantis Investors calculations.
Notes: Monthly U.S. equity returns are from the Fama-French 5×5 portfolios sorted on book-to-market equity and operating profitability. More Attractively Priced, More Profitable Companies and Less Attractively Priced, Less Profitable Companies are market-cap-weighted composites from the most and least favorable regions of the 5×5 matrix, respectively. The analysis uses the full monthly history available from the Fama-French data library. Yield environments are based on monthly changes in the 10-year U.S. Treasury yield. Returns are annualized. Past performance is no guarantee of future results.
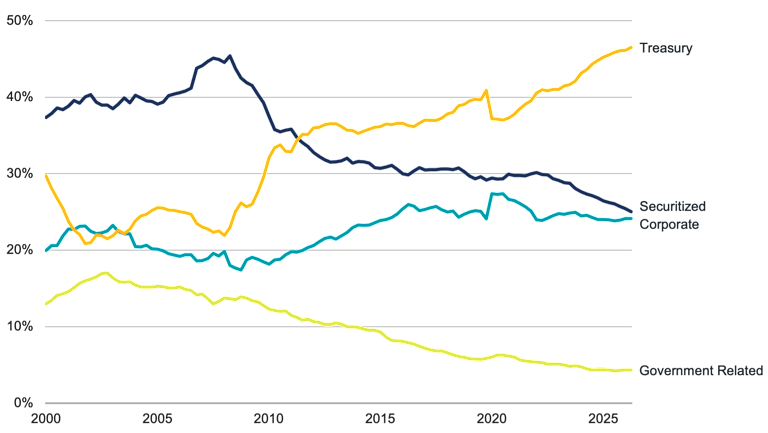
Fixed-income investors face a different set of considerations. Most bond indexes are weighted by debt outstanding, meaning issuers receive greater benchmark weight as they borrow more. As shown in Figure 5, that mechanic has materially changed the composition of the U.S. bond market. In fact, U.S. Treasury securities increased from less than one-quarter of the public investment-grade market in much of the 2000s to nearly one-half today.
Figure 5 | Government Borrowing Has Reshaped the Bond Market
Source: Bloomberg.
Notes: Sector weights are based on market value. The four sub-indexes shown sum to the Bloomberg U.S. Aggregate Bond Index. Government Related includes agency and supranational issuers. Securitized includes mortgage-backed, asset-backed, and commercial mortgage-backed securities.
Treasury securities can provide liquidity, diversification, and protection. But their growing weight highlights an important distinction between equity and bond benchmarks. Equity indexes generally allocate more capital to companies that become more valuable. Bond indexes generally allocate more capital to issuers that create more debt. Benchmark composition, therefore, reflects where borrowing has occurred, not necessarily where investors receive the most attractive combination of yield, maturity, credit quality, and price.
Markets involve uncertainty. The challenge is not identifying every winner in advance. It is allocating capital in a way that balances expected returns and risks across a wide range of possible outcomes. A higher cost of capital may influence the opportunity set available to investors, but it does not change the importance of diversification, valuation, and a disciplined investment process. Those principles remain relevant across market environments.
Bonus: Politics and Equity Returns
While elections often attract significant attention from investors, historical evidence suggests that the political composition of Washington has had a limited relationship with long-term U.S. equity returns. In fact, since 1871, median U.S. equity returns have varied by less than 1 percentage point across periods of unified Republican control of the presidency and Congress (5.8%), divided government (5.9%), and unified Democratic control (5.3%). Although political leadership can change policy, the broad similarity in outcomes across government configurations suggests that equity returns have been driven more by factors such as starting valuations and corporate profitability than by the party in control of Washington.
Positive U.S. Equity Outcomes Have Historically Been Common Across Political Environments
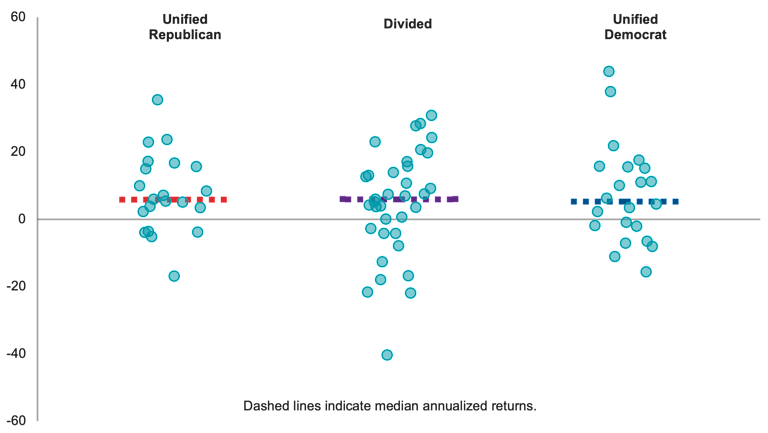
Sources: Robert Shiller Data Library and U.S. House of Representatives: History, Art & Archives. Notes: Data as of September 30, 2026. Unified Republican and Unified Democratic governments indicate common party control of the Presidency, House, and Senate. Divided government indicates split party control. Returns are annualized and based on Shiller's U.S. stock market price return index. Prior to the 20th Amendment, congressional return periods represent April to March. Following its adoption in 1933, return periods represent February to January. Individual observations represent congressional terms. Past performance is no guarantee of future results.
Explore More Insights
Glossary:
Represents securities that are taxable, registered with the Securities and Exchange Commission, and U.S. dollar-denominated. The index covers the U.S. investment-grade fixed-rate bond market, with index components for government and corporate securities, mortgage pass-through securities, and asset-backed securities.
Entity responsible for oversight of a nation’s monetary system, including policies and interest rates.
Debt instruments issued by corporations, as distinct from those issued by governments, government agencies, or municipalities. Corporate securities typically have the following features: 1) they are taxable, 2) they tend to have more credit (default) risk than government or municipal securities, so they tend to have higher yields than comparable-maturity securities in those sectors; and 3) they are traded on major exchanges, with prices published in newspapers.
Credit quality reflects the financial strength of the issuer of a security, and the ability of that issuer to provide timely payment of interest and principal to investors in the issuer's securities. Common measurements of credit quality include the credit ratings provided by credit rating agencies such as Standard & Poor's and Moody's. Credit quality and credit quality perceptions are a key component of the daily market pricing of fixed-income securities, along with maturity, inflation expectations and interest rate levels.
Valuation theory shows that the expected return of a stock is a function of its current price, its book equity (assets minus liabilities) and expected future profits, and that the expected return of a bond is a function of its current yield and its expected capital appreciation (depreciation). We use information in current market prices and company financials to identify differences in expected returns among securities, seeking to overweight securities with higher expected returns based on this current market information. Actual returns may be different than expected returns, and there is no guarantee that the strategy will be successful.
A measure of the total economic output in goods and services for an economy.
Cloud computing companies operating at a very large scale.
Typically used in reference to fixed income securities that possess relatively high credit quality and have credit ratings in the upper ranges of those provided by credit rating services. Using Standard & Poor's ratings as the benchmark, investment-grade securities are those rated from AAA at the highest end to BBB- at the lowest. To earn these ratings, securities, in the judgment of the rating agency, are projected to have relatively low default risk.
Liquidity describes the degree to which an asset or security can be quickly bought or sold in the market without affecting the asset's price.
For most bonds and other fixed-income securities, real yield is simply the yield you see listed online or in newspapers (see Yield) minus the premium (extra yield) added to help counteract the effects of inflation (see Inflation). Most "nominal" fixed-income yields (see Nominal yield) include an "inflation premium" that is typically priced into the yields to help offset the effects of inflation. Real yields, such as those for TIPS, don't have the inflation premium. As a result, TIPS yields and other real yields are typically lower than most nominal yields.
The yield (defined below) of a Treasury security (most often refers to U.S. Treasury securities issued by the U.S. government).
Debt securities issued by the U.S. Treasury and backed by the direct "full faith and credit" pledge of the U.S. government. Treasury securities include bills (maturing in one year or less), notes (maturing in two to 10 years) and bonds (maturing in more than 10 years). They are generally considered among the highest quality and most liquid securities in the world.
For bonds and other fixed-income securities, yield is a rate of return on those securities. There are several types of yields and yield calculations. "Yield to maturity" is a common calculation for fixed-income securities, which takes into account total annual interest payments, the purchase price, the redemption value, and the amount of time remaining until maturity.
—
Investment return and principal value of security investments will fluctuate. The value at the time of redemption may be more or less than the original cost. Past performance is no guarantee of future results.
This material has been prepared for educational purposes only. It is not intended to provide, and should not be relied upon for, investment, accounting, legal or tax advice.
The opinions expressed are those of the investment portfolio team and are no guarantee of the future performance of any Avantis Investors portfolio.