Three Things Investors Should Know About Today’s Bond Market

Key Takeaways
The growing share of Treasuries in the bond market highlights the impact of U.S. debt growth and the need for careful portfolio diversification.
Despite being riskier than Treasuries, corporate bonds have historically delivered stronger long-term returns with default rates under 1% for most credit tiers.
Global bonds have offered broader diversification and higher yield potential, with some non-U.S. markets outperforming U.S. bonds when currency risk is hedged.
In a volatile year for U.S. stocks, the overall U.S. bond market has maintained a positive year-to-date total return throughout 2025. For investors allocating to balanced portfolios of both asset classes, bonds are likely to have played a useful role, sometimes helping offset periods of disappointing stock returns and reducing total portfolio volatility.
However, this doesn’t mean bond investors have been spared from uncertainty. Fears surrounding U.S. government debt levels and potential effects on the Treasury market have been widely publicized. Reports that proposed tax legislation could add more to the U.S. deficit in the years ahead and Moody’s recent downgrade of its U.S. debt rating have contributed to market anxiety, coinciding with the 30-year U.S. Treasury yield topping 5% for the first time since 2023.
Many predictions about the bond market will circulate, but investors should be cautious not to let opinions and resulting emotions dictate their portfolio decisions. We believe a more constructive approach for bond investors would be to carefully evaluate what you own, assess diversification and risk characteristics, and verify if current exposures are aligned with long-term goals.
To help, we offer some facts on the bond market, highlighting a few things you may not know but would likely be wise to consider.
1. Treasuries Make Up Half of the U.S. Bond Market in 2025
To start, let’s consider the composition of today’s U.S. bond market. This includes several sectors, like Treasuries, agencies, corporates and securitized bonds. But how much weight is in each and why?
Many may know how the equity market is measured through popular indexes such as the S&P 500® and the Russell 3000®. These indexes weight stocks by their market capitalization, giving larger weight to bigger companies and smaller weight to smaller companies.
It’s different with bonds. Index weighting is typically based on debt outstanding, which means greater exposure to the most indebted issuers and less exposure to those with lower debt levels.
The result? Considerable weight in U.S. Treasuries.
Over the last 20 years, the weight of U.S. government-issued bonds (longer-term Treasuries and short-term T-bills) has increased from about 25% of the U.S. bond market to around 50% as U.S. government debt has risen faster than for other bond sectors (Figure 1).
Figure 1 | Government Bonds Dominate the U.S. Bond Market
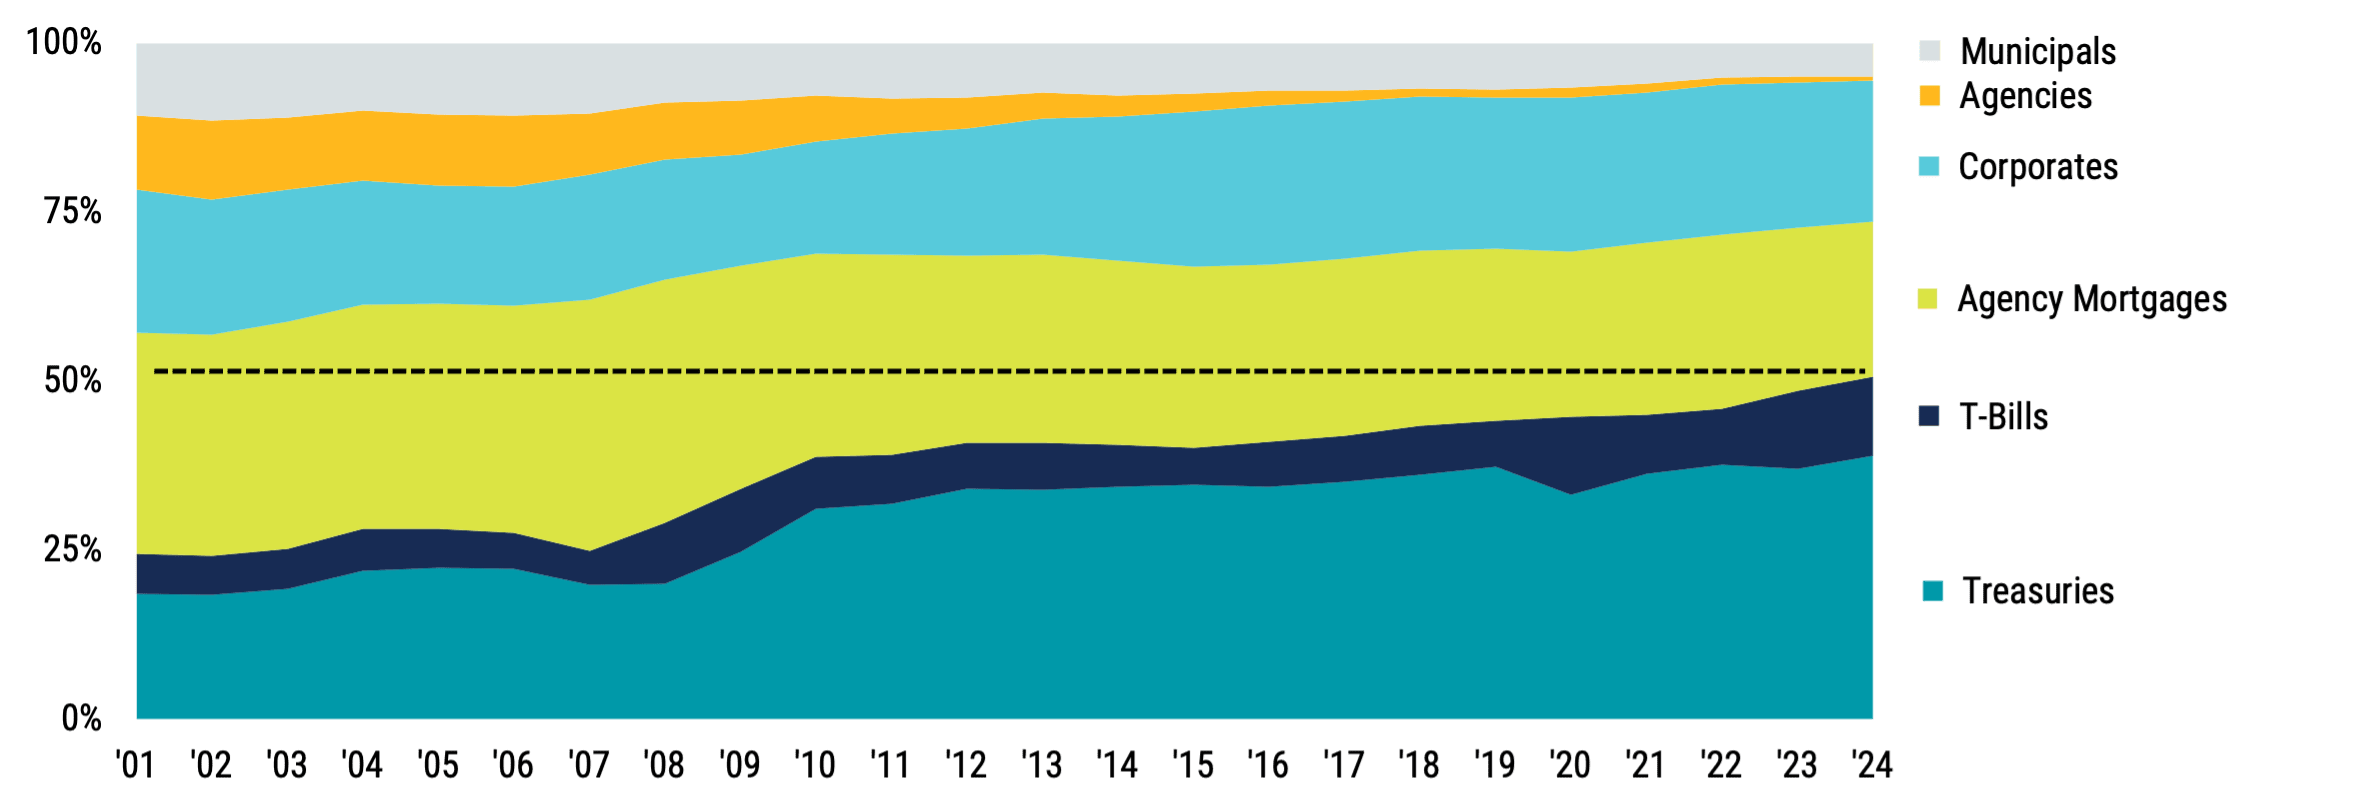
Data from 2001–2024. Source: Bloomberg. Municipals are bonds issued by municipalities such as states, cities, and counties. Agency Mortgages are mortgage-backed securities typically issued by U.S. government agencies.
Because agency bonds and much of the U.S. mortgage bond market are also backed by the government, total government-related debt makes up more than 70% of the market today!
Giving more weight to issuers with higher levels of debt can raise eyebrows regarding risk management. Still, it can also have important implications for expected returns as Figure 2 demonstrates.
Figure 2 | Corporate Bonds Have Historically Offered Higher Growth Potential
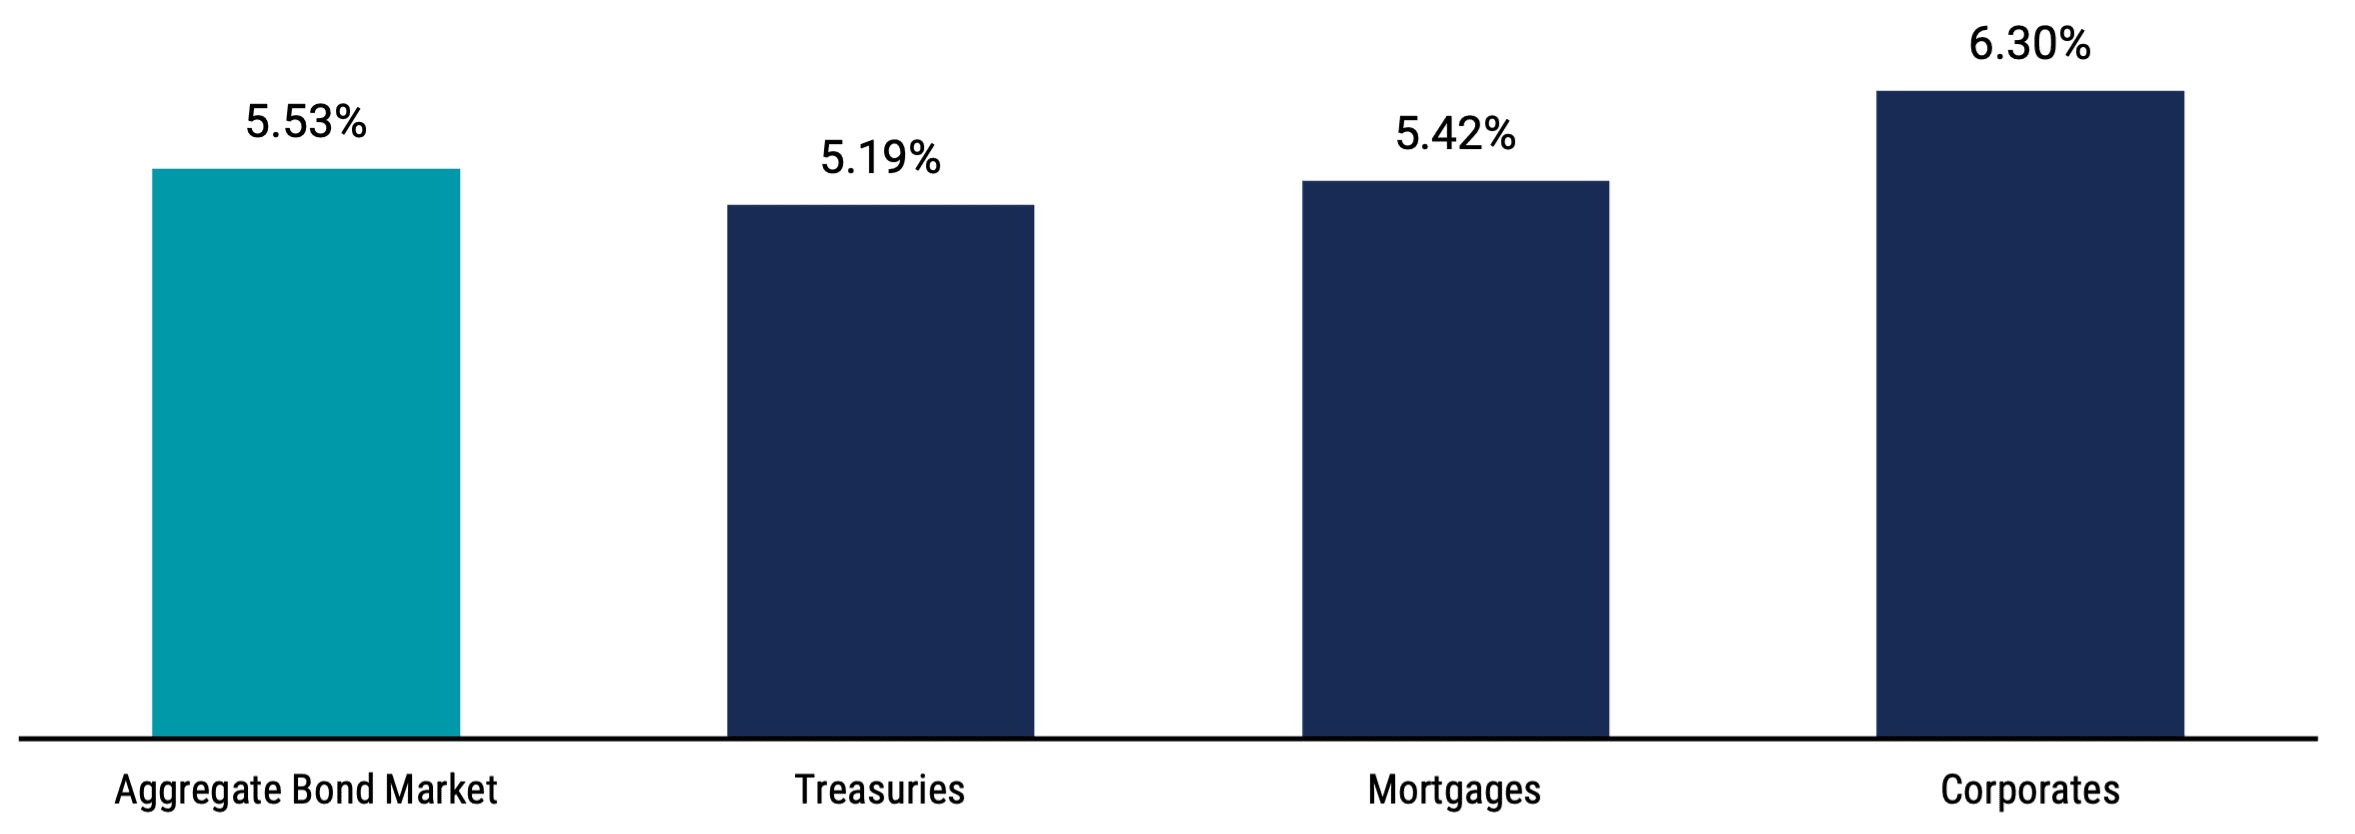
Data from 1/1/1986–4/30/2025. Aggregate bond market is represented by the Bloomberg US Aggregate Bond Index. Treasuries, mortgages and corporates are represented by the individual sectors within that index. Source: Bloomberg, Avantis Investors. Past performance is no guarantee of future results.
The annualized return for Treasury bonds since 1986 is a respectable 5.19%, while mortgages have returned a bit more at 5.42%. Corporate bonds have well outpaced both, at 6.30%, over the same period.
2. Most Corporate Bond Segments Have Historically Offered Stronger Growth Potential with Relatively Low Default Risk
Perhaps it’s not surprising that corporate bonds have outperformed Treasuries, historically referred to as “risk-free.” Don’t corporate bonds come with more risk? If risk is measured by the potential for default, then that risk may not be as large as you think.
In Figure 3, we present historical data on the trade-offs between default risk and returns across corporate bonds of varying qualities, spanning both lower-risk investment-grade corporate bonds (rated AAA through BBB) and relatively higher-risk speculative-grade or “high-yield” bonds (rated BB through CCC).
Figure 3 | U.S. Corporate Bonds Have Historically Offered Attractive Risk/Return Characteristics
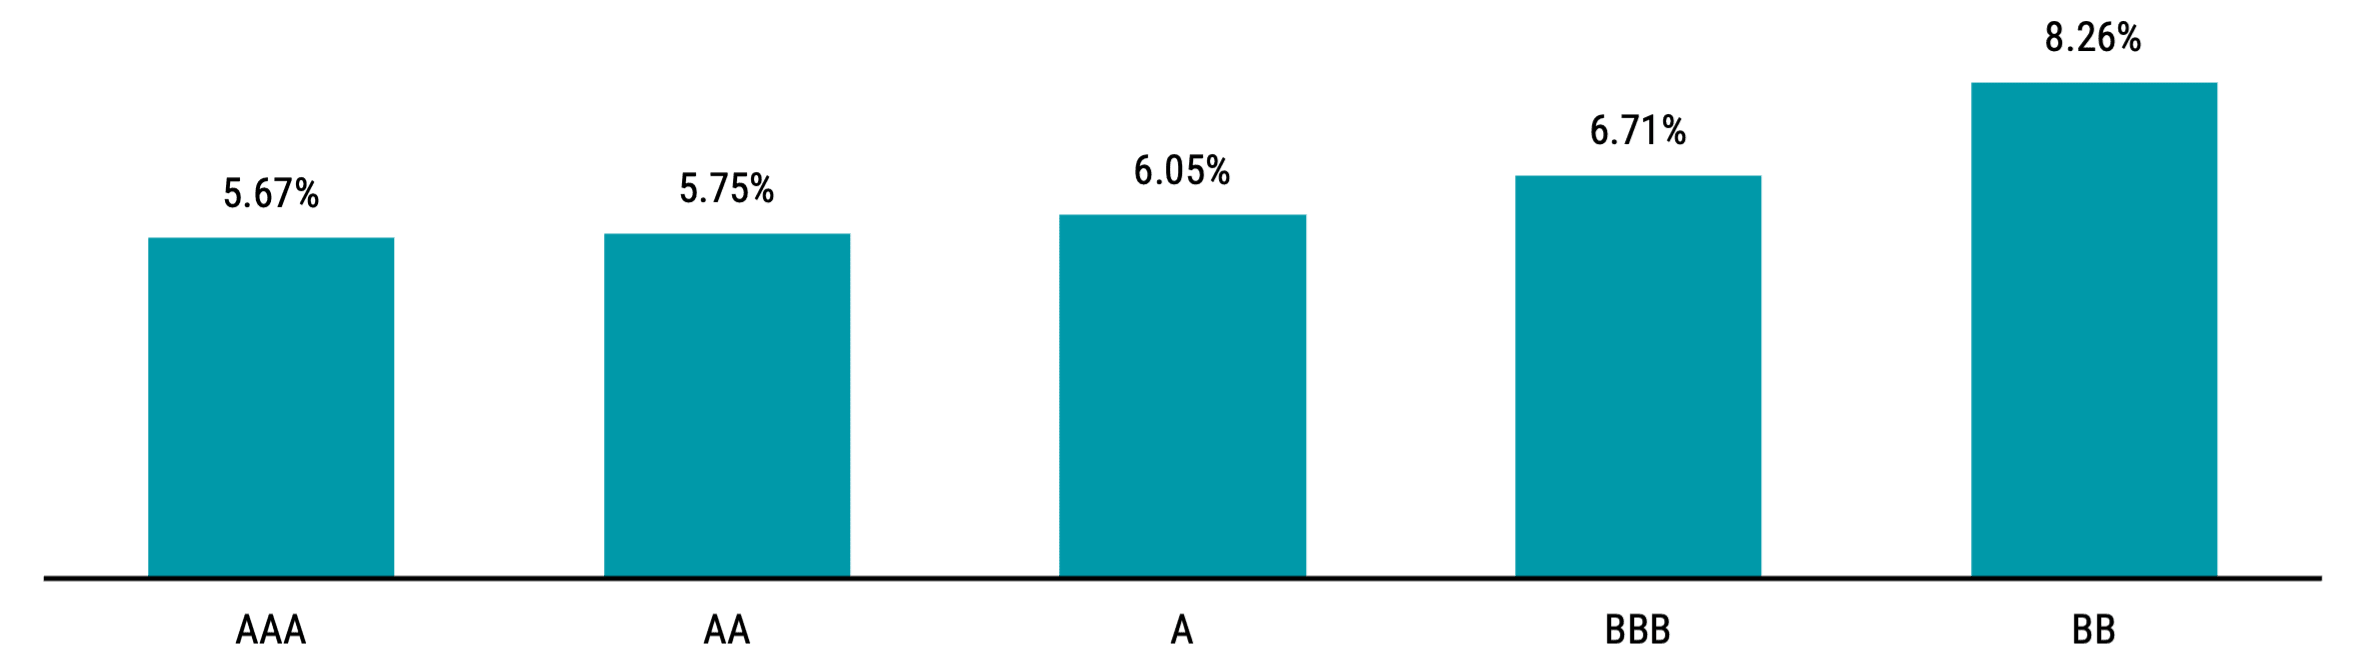
Data from 1/1/1986–4/30/2025. Returns source: Bloomberg, Avantis Investors. Ratings AAA, AA, A, and BBB are segments within the Bloomberg U.S. Aggregate Bond Index. BB is a segment within the Bloomberg U.S. High Yield Index. Past performance is no guarantee of future results.
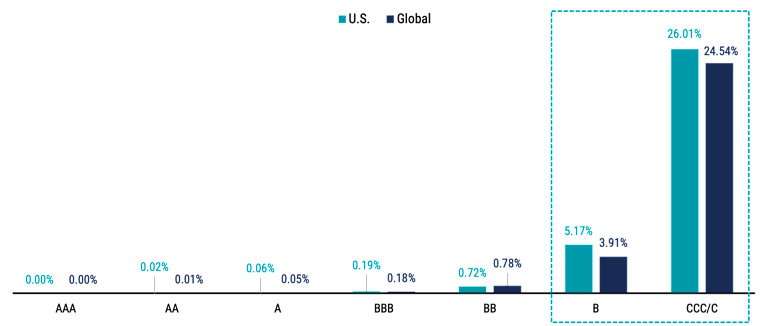
Data from 1/1/1981–12/31/2024. Default Rate Source: S&P Global Ratings Research, Avantis Investors. Past performance is no guarantee of future results.
We observe that historically, returns have increased with lower credit ratings, reflecting the premium paid to investors for taking on higher expected risk. But, examining the realized default rates from higher to lower credit ratings shows that you must go pretty far out on the rating spectrum to see meaningful increases in default.
Since 1981, the annual average default rate for all investment-grade-rated bonds and even upper-tier high-yield bonds (BB-rated issues) has remained below 1%. This holds true for both U.S. and non-U.S. corporates.
3. Global Bonds Offer Another Opportunity to Enhance Diversification and Returns
While the U.S. bond market is the largest in the world, a vast opportunity set exists in global markets outside the U.S. In its 2024 capital markets fact book, the Securities Industry and Financial Markets Association (SIFMA) estimates that the total value of the global debt market is about $141 trillion, with the U.S. comprising 39%. This means global markets offer access to a far wider set of bonds, issuers and yield curves, which can provide an opportunity to enhance diversification and expected returns.
In Figure 4, we provide a snapshot of a selection of current global corporate yield curves to highlight the potential upside of expanding the investment universe beyond U.S bonds. This includes BBB-rated corporate curves for bonds issued in the U.S. dollar (USD), euro (EUR), Canadian dollar (CAD) and British pound (GBP). All non-USD curves are hedged to USD, which, in practical terms, can help to minimize the currency-driven volatility of holding foreign bonds in their local currencies.
Figure 4 clearly shows that some yield curves for non-USD currencies, when hedged to USD, offer higher yields today than comparable USD bonds. Yield is one component of a bond’s expected return. Global yield curves also tend not to move perfectly in line, allowing investors to potentially benefit from diversifying across multiple markets.
Figure 4 | Global Markets Can Offer Upside
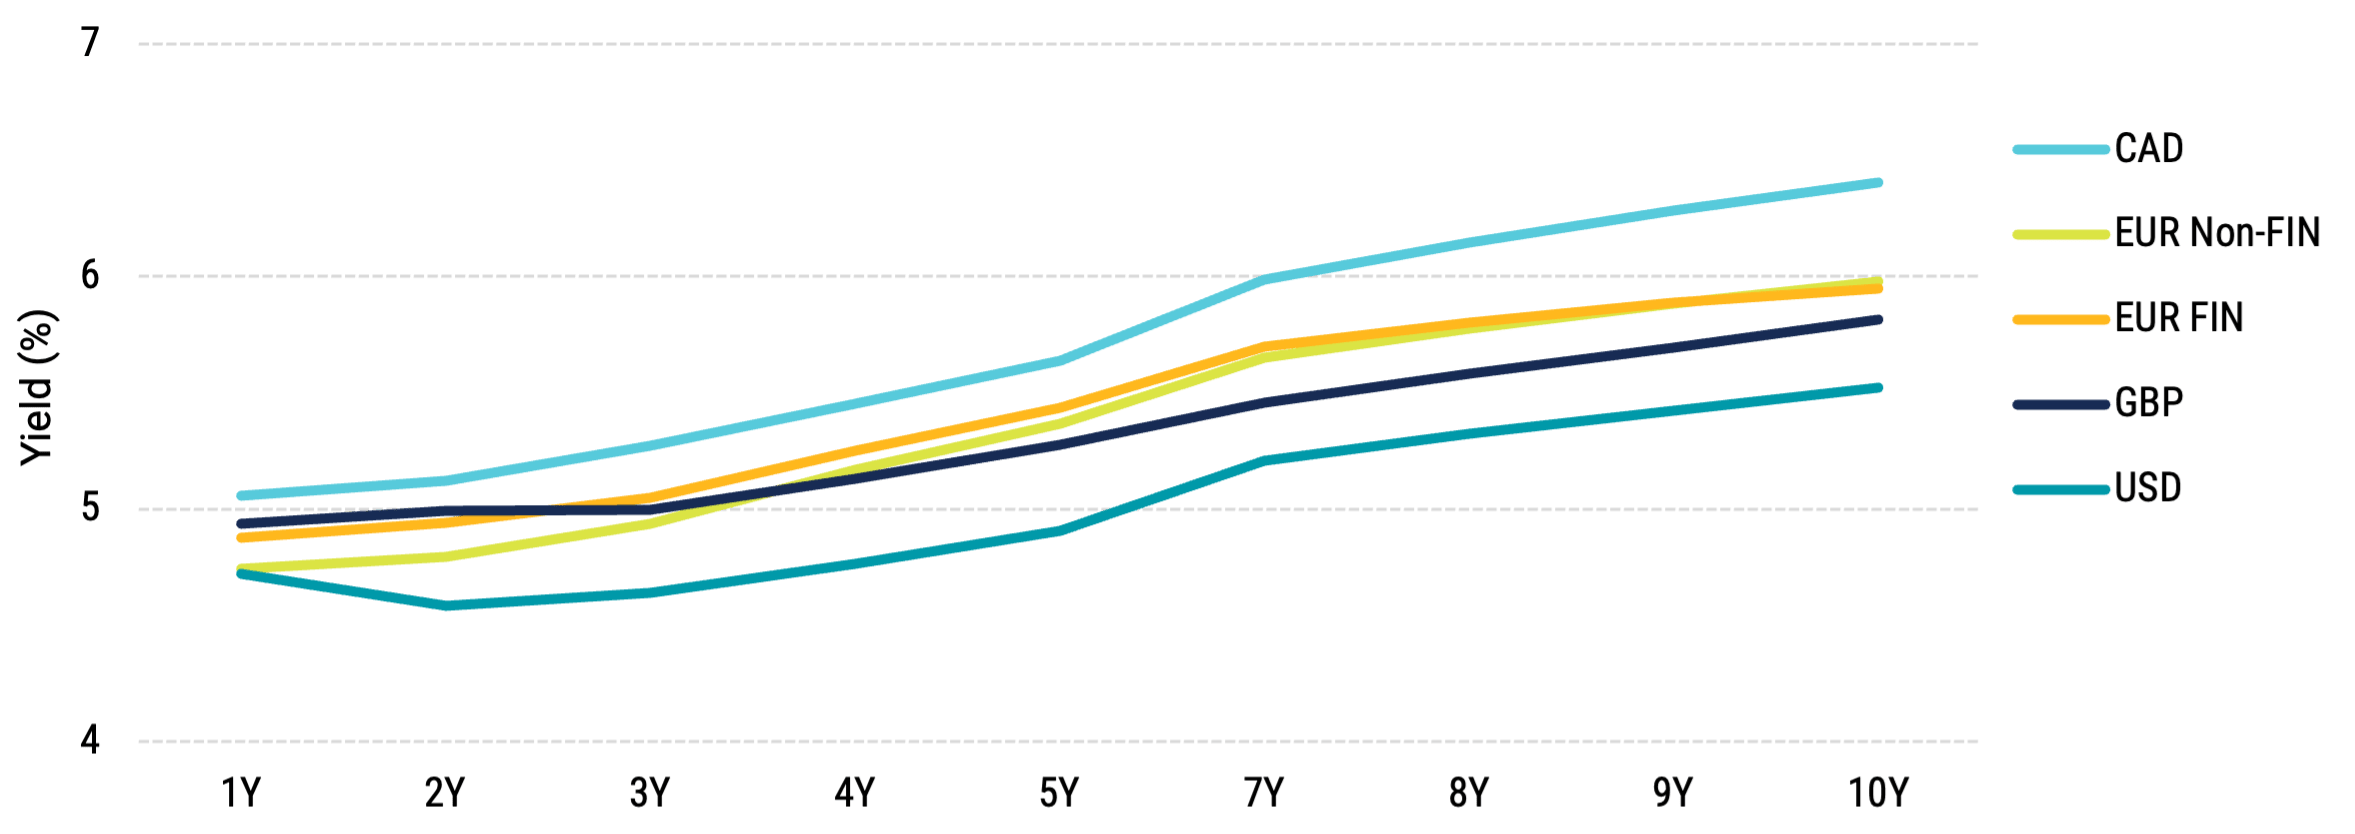
Data as of 4/30/2025. Source: Bloomberg, Avantis Investors. FIN indicates the financial sector. Non-FIN indicates corporate sectors excluding financials. Diversification does not assure a profit nor does it protect against loss of principal. Past performance is no guarantee of future results.
That’s not to say there are no trade-offs for investors to think about.
Figure 5 illustrates that pursuing higher growth potential in bonds can come with relatively higher volatility, which may be an important consideration for investors depending on the role that bonds play in their portfolios.
Figure 5 | Trade-offs in Returns and Volatility in Balanced Stock/Bond Portfolios
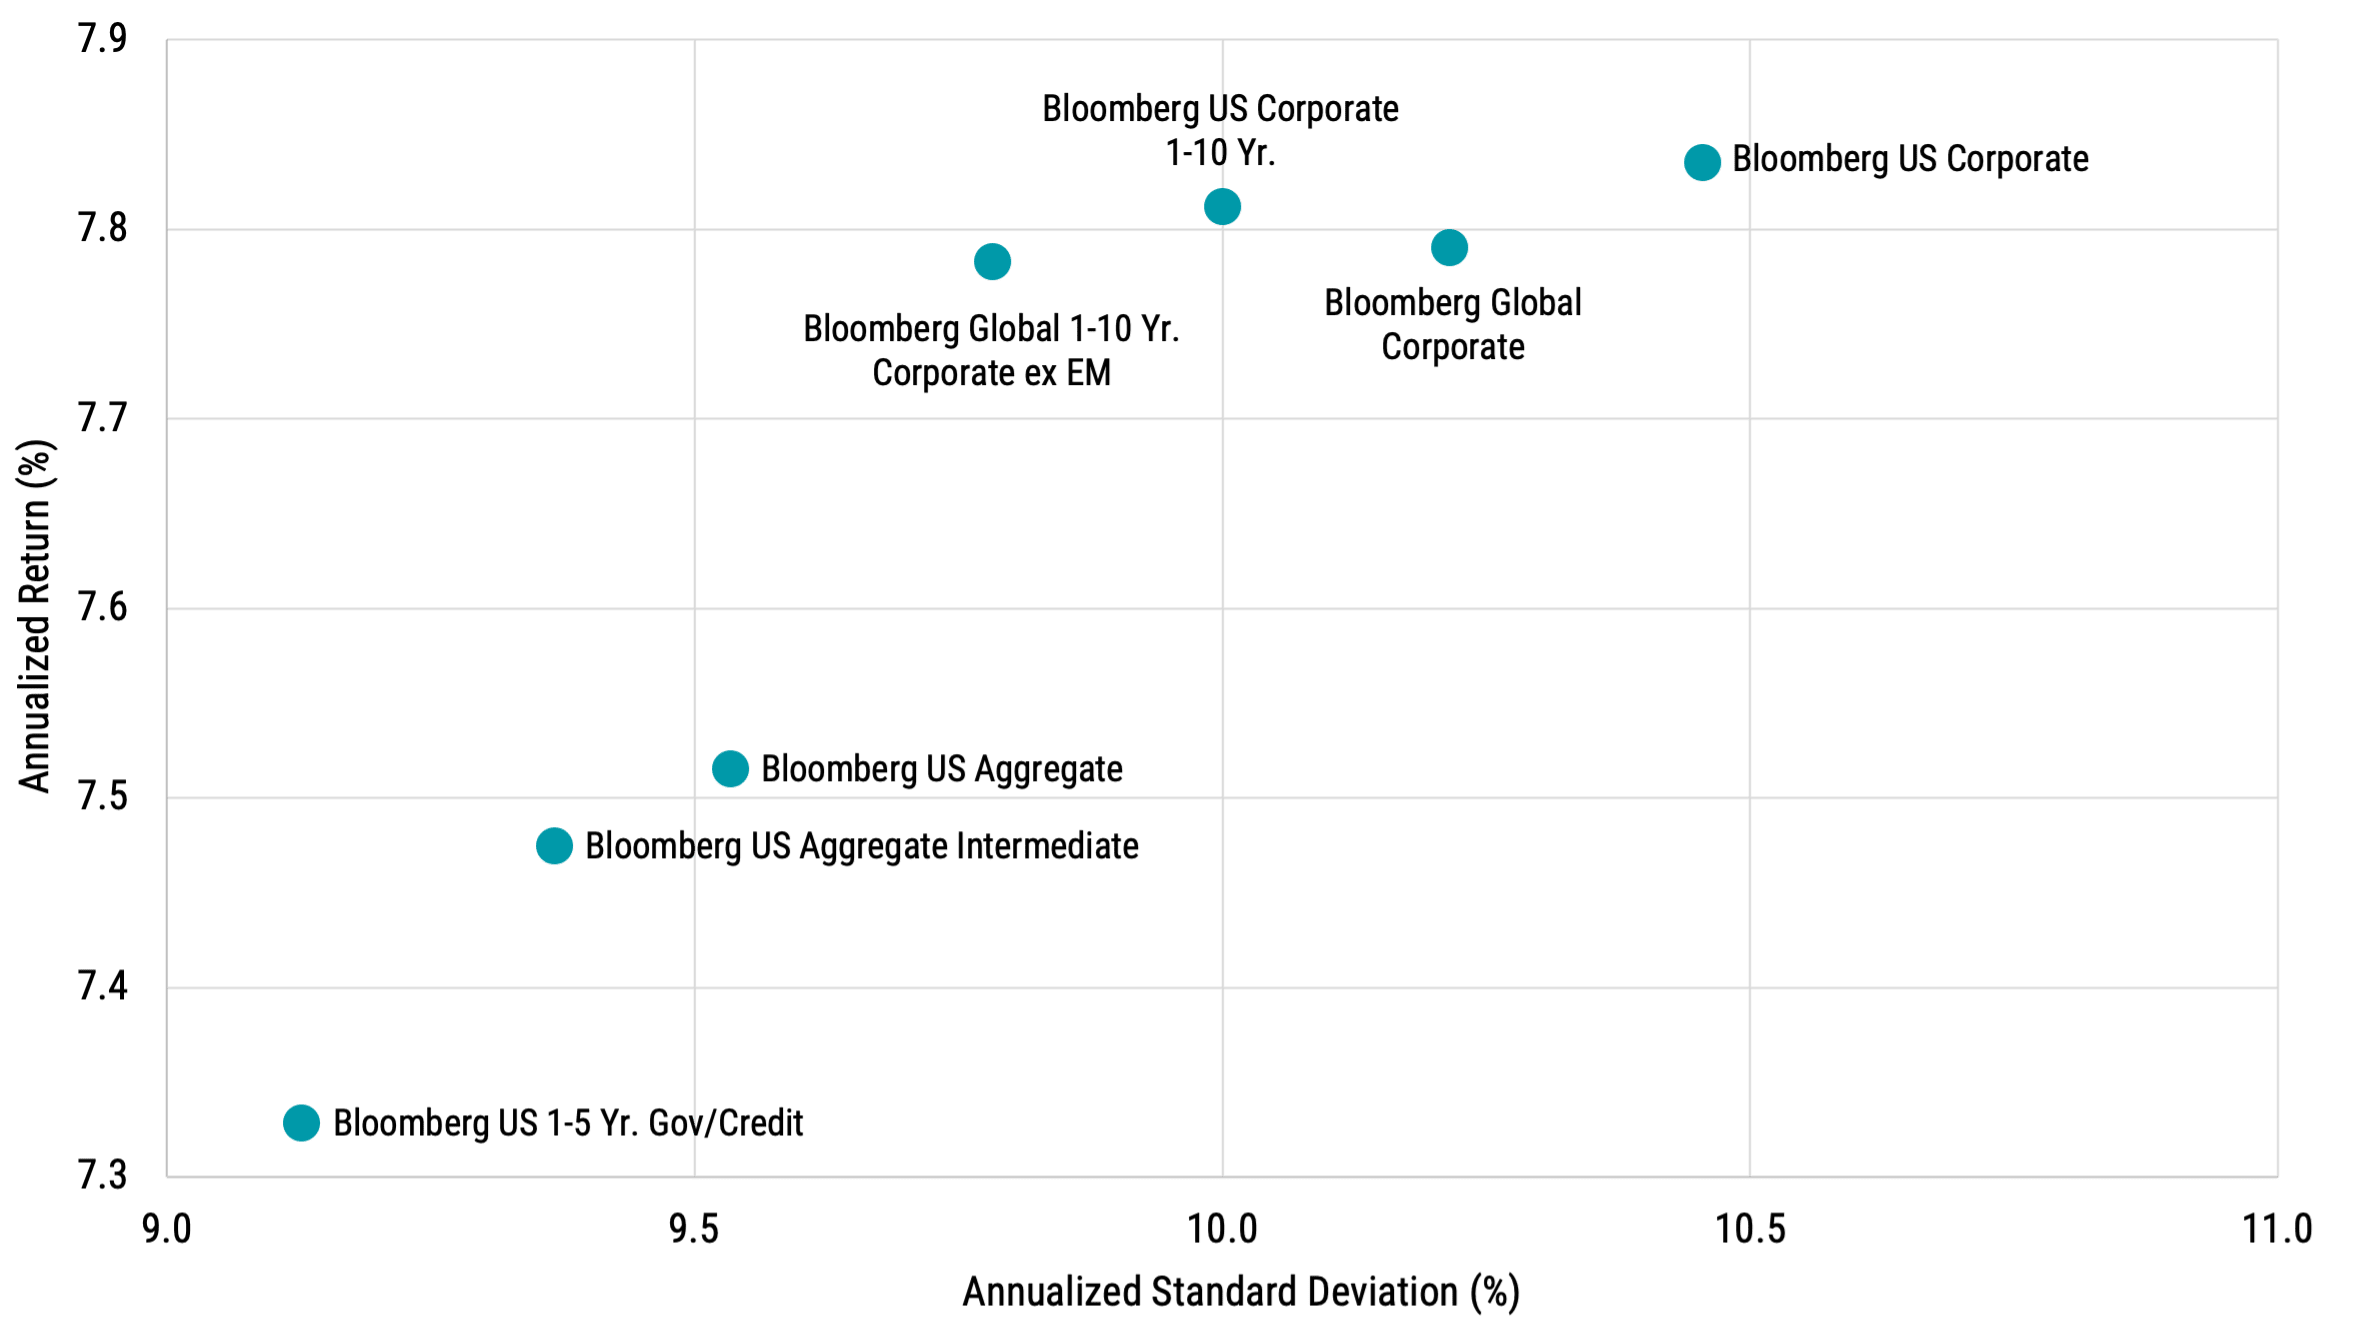
Data from 2/2025–4/2025. Performance in USD. Non-USD indexes hedged to USD. Source: Bloomberg, Avantis Investors. Past performance is no guarantee of future results.
Diversification does not assure a profit nor does it protect against loss of principal.
The chart illustrates historical returns compared to volatility for pairings of the S&P 500 Index (60%) and various U.S. and global fixed income indexes (40%). Generally, we find that dedicated corporate exposure helps to drive higher returns but with higher volatility versus the other indexes. Global corporate bonds have shown potentially appealing risk and return trade-offs versus U.S. corporates alone.
However, for investors seeking lower levels of volatility, the overall U.S. bond market has provided this compared to corporate-only bond allocations. Short-term U.S. market exposure (U.S. 1-5 Yr Gov/Credit) has offered even less volatility.
Navigating Bonds in a Volatile Market
Anxiety is often an unavoidable part of investing. These days, it’s easy to encounter opinions on the market and fear how they might affect our portfolios. But, in our view, investors are better served by building portfolios that can help them withstand this noise.
We may not know what markets will do next, but there are aspects of our investment journey we can control. We can establish clear long-term goals, make sure we know how our investments are helping us achieve them, and understand the levers available to us to better pursue our goals when needed.
Plus, never forget that diversification is a powerful tool for mitigating risk and managing anxiety when uncertainty arises.
Explore More Insights
Glossary
Agencies: Agency securities are debt securities issued by U.S. government agencies such as the Federal Home Loan Bank and the Federal Farm Credit Bank. Some agency securities are backed by the full faith and credit of the U.S. government, while others are guaranteed only by the issuing agency.
Bloomberg Global 1–10 Year Corporate ex-Emerging Markets Index: A bond index that tracks the performance of investment-grade corporate bonds issued by companies from developed markets around the world and excludes emerging markets. The index focuses on corporate bonds with maturities ranging from 1 to 10 years.
Bloomberg Global Corporate Bond Index: Tracks the performance of investment-grade corporate bonds issued by companies from developed markets around the world.
Bloomberg U.S. 1–5 Year Government/Credit Index: Tracks the market for investment-grade, U.S. dollar-denominated, fixed-rate treasuries, government-related and corporate securities with a maturity between one and five years.
Bloomberg U.S. Aggregate Bond Index: Represents securities that are taxable, registered with the Securities and Exchange Commission, and U.S. dollar-denominated. The index covers the U.S. investment-grade fixed-rate bond market, with index components for government and corporate securities, mortgage pass-through securities and asset-backed securities.
Bloomberg U.S. Aggregate Intermediate Index: The intermediate component of the U.S. Aggregate Bond Index which covers the U.S. investment-grade fixed-rate bond market, with index components for government and corporate securities, mortgage pass-through securities and asset-backed securities.
Bloomberg U.S. 1–10 Year Corporate Bond Index: Consists of publicly issued U.S. corporate and specified foreign debentures that are registered with the Securities and Exchange Commission and meet specific maturity, liquidity, and quality requirements. The bonds in the index are investment-grade with a maturity between one and 10 years.
Bloomberg U.S. Corporate Bond Index: Measures the investment-grade, fixed-rate, taxable corporate bond market. It includes U.S. dollar-denominated securities publicly issued by U.S. and non-U.S. industrial, utility and financial issuers.
Corporate securities (corporate bonds and notes): Debt instruments issued by corporations, as distinct from those issued by governments, government agencies, or municipalities.
Credit Quality: Refers to the creditworthiness or financial health of the issuer of the bond. It reflects the likelihood that the issuer will meet its debt obligations, including interest payments and the return of principal, in a timely manner. Credit rating agencies assess and assign credit ratings to bonds based on the issuer's financial strength, stability, and ability to honor its debt commitments.
Credit Rating: Standard & Poor’s credit ratings range from AAA (highest quality; perceived as least likely to default) to D (in default). Securities and issuers rated AAA to BBB are considered/perceived to be "investment-grade"; those below BBB are considered/perceived to be non-investment-grade (high yield).
Default: Failure of a debtor to make timely payments of interest and principal as they become due, or to meet some other provision of a bond indenture. In the event of default, bondholders may make claims against the assets of the issuer to recoup their principal.
Default rate: Refers to the percentage of bond issuers that fail to make timely interest payments or repay the principal amount as per the terms of the bond agreement.
Expected Returns: Valuation theory shows that the expected return of a stock is a function of its current price, its book equity (assets minus liabilities) and expected future profits, and that the expected return of a bond is a function of its current yield and its expected capital appreciation (depreciation). We use information in current market prices and company financials to identify differences in expected returns among securities, seeking to overweight securities with higher expected returns based on this current market information. Actual returns may be different than expected returns, and there is no guarantee that the strategy will be successful.
High-yield bonds: Fixed income securities with lower credit quality and lower credit ratings. High-yield securities are those rated below BBB- by Standard & Poor's.
Investment-grade: Typically used in reference to fixed income securities that possess relatively high credit quality and have credit ratings in the upper ranges of those provided by credit rating services. Using Standard & Poor's ratings as the benchmark, investment-grade securities are those rated from AAA at the highest end to BBB- at the lowest. To earn these ratings, securities, in the judgment of the rating agency, are projected to have relatively low default risk.
Market Capitalization: The market value of all the equity of a company's common and preferred shares. It is usually estimated by multiplying the stock price by the number of shares for each share class and summing the results.
Russell 3000® Index: Measures the performance of the largest 3,000 U.S. companies representing approximately 98% of the investable U.S. equity market.
S&P 500® Index: A market-capitalization-weighted index of the 500 largest U.S. publicly traded companies. The index is widely regarded as the best gauge of large-cap U.S. equities.
Standard Deviation: A statistical measurement of variations from the average. In financial literature, it’s often used to measure risk when risk is measured or defined in terms of volatility. In general, more risk means more volatility and more volatility means a higher standard deviation — there’s more variation from the average of the data being measured.
Treasury Yield: The yield of a Treasury security (most often refers to U.S. Treasury securities issued by the U.S. government).
U.S. Treasury securities: Debt securities issued by the U.S. Treasury and backed by the direct “full faith and credit” of the U.S. government. Treasury securities include bills (maturing in one year or less), notes (maturing in two to 10 years) and bonds (maturing in more than 10 years).
Yield: The rate of return for bonds and other fixed-income securities. Price and yield are inversely related: As the price of a bond goes up, its yield goes down, and vice versa.
Yield Curve: A line graph showing the yields of fixed income securities from a single sector (such as Treasuries or municipals) but from a range of different maturities (typically three months to 30 years) at a single point in time (often at month-, quarter- or year-end). Maturities are plotted on the x-axis of the graph, and yields are plotted on the y-axis. The resulting line is a key bond market benchmark and a leading economic indicator.
Generally, as interest rates rise, the value of the bonds held in the fund will decline. The opposite is true when interest rates decline.
Diversification does not assure a profit nor does it protect against loss of principal.
International investing involves special risks, such as political instability and currency fluctuations. Investing in emerging markets may accentuate these risks.
It is not possible to invest directly in an index.
Investment return and principal value of security investments will fluctuate. The value at the time of redemption may be more or less than the original cost. Past performance is no guarantee of future results.
This material has been prepared for educational purposes only. It is not intended to provide, and should not be relied upon for, investment, accounting, legal or tax advice.
©2026 Standard & Poor's Financial Services LLC. The S&P 500® Index is composed of 500 selected common stocks most of which are listed on the New York Stock Exchange. It is not an investment product available for purchase.