Pro Sports Teams vs. Public Stocks: Which Has Provided Better Returns?

Key Takeaways
Historical data have shown public markets delivered competitive returns, even compared to high-profile sports team investments.
Despite high sale prices, several sports teams underperformed compared to public stock benchmarks over similar time frames.
Public markets offer transparent, liquid, and scalable investment options that may help everyday investors pursue long-term goals.
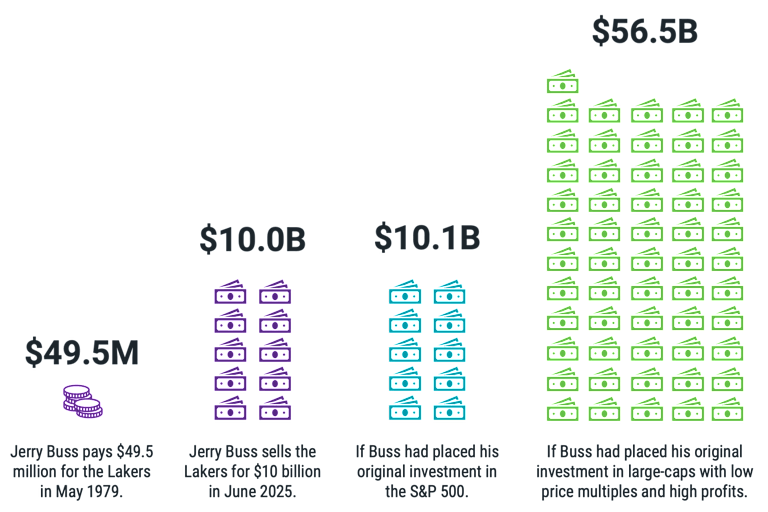
Jerry Buss purchased the Los Angeles Lakers of the National Basketball Association (NBA) in May 1979 as part of a deal that also included the Los Angeles Kings of the National Hockey League (NHL), the Lakers’ basketball arena (the Forum), and a 13,000-acre ranch.
In total, he paid $67.5 million. In June of 2025, the Buss family (Jerry passed away in 2013) sold the Lakers for a staggering $10 billion — the largest-ever sales price for a professional sports franchise.
What If Jerry Buss Had Invested in Stocks Instead?
$10 billion is undoubtedly a big payday for the Busses. Still, a story bouncing around online forums from multiple sources suggests that he might have received an even better return simply by investing in public stocks.
To demonstrate, we ran the numbers ourselves. Computing the annualized return on $67.5 million growing to $10 billion between May 1979 and June 2025 comes out to 11.5% per year. Over that same period, the S&P 500® Index returned 12.2% per year.
Many people find this outcome surprising, but it also fails to consider important details. He didn’t just buy the Lakers with that investment.
Estimates of the original deal in 1979 value the Lakers at $16 million, the Kings at $8 million, the Forum arena at $33.5 million, and the ranch at $10 million. If we isolate the Lakers and the Forum as a key revenue-generating property for the team, we estimate the Lakers' purchase price at $49.5 million.
In Figure 1, we share our modified results on how the Buss family’s return compares to U.S. stocks over the same period. If Buss had invested $49.5 million in the S&P 500 and held through June 2025, it would be worth about $10.1B today — still a modest $100 million improvement on the recent sale proceeds.
Figure 1 | Investing in Public Stocks Would Have Outpaced Buss’s Return on the Lakers
Data from 6/1/1979 – 6/30/2025. Source for S&P 500 Index: Bloomberg. Source for large-caps with low price multiples and high profitability: Avantis Investors and Sunil Wahal, CRSP/Compustat, U.S. securities. Large-caps generally represent the top 90% of the U.S. market capitalization. “Low Price Multiple” is defined as companies with a high book-to-market ratio. “High profitability” is defined as companies with a high profits-to-book ratio. Past performance is no guarantee of future results.
But what if we look beyond the S&P 500? While a popular gauge of U.S. market performance, it’s simply designed to capture the 500 largest companies in the U.S. stock market, giving higher weight to the largest companies regardless of their fundamentals.
If Buss had also considered company valuations, which contain information about differences in expected returns among companies, and invested only in U.S. large-caps with strong balance sheets, good profits and attractive prices (low price multiples and high profitability), the investment would have grown to more than $56 billion!1
These outcomes run contrary to what many might expect. Sports team owners (primarily billionaires) often seem to be earning outsized returns that the average investor can’t access. But Buss’s return on the Lakers is just one example. What about other sports team investments?
How Top Sports Teams Stack Up Against Public Stocks
In Figures 2, 3 and 4, we present the same analysis for the five most valuable teams in the NBA, National Football League (NFL) and Major League Baseball (MLB). Since most teams were not recently purchased like the Lakers, we use the latest estimates of their values. We then compare these values to the amounts that could have been generated had each owner placed their original team investment in our two U.S. stock scenarios.
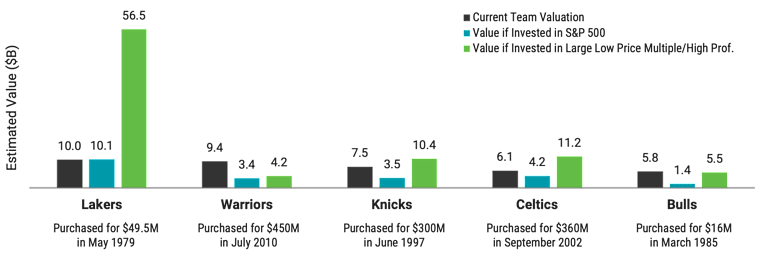
The results show that only a few teams from this sample (beyond the Lakers) have failed to deliver a better return than the S&P 500 since they were last purchased: the Los Angeles Dodgers, bought in 2012 for $2 billion, and the Chicago Cubs, bought in 2009 for $700 million.
The story would have been quite different if the investments had been placed in U.S. large-cap stocks with attractive valuations. This option would have produced more value to owners from 12 out of the 15 teams assessed (3 out of 5 NBA teams, 4 out of 5 NFL teams, and 5 out of 5 MLB teams).
Figure 2 | Return on NBA Team Investments vs. U.S. Stocks
Panel A | Comparison of estimated values as of 6/30/2025
Panel B | Results Summary Table
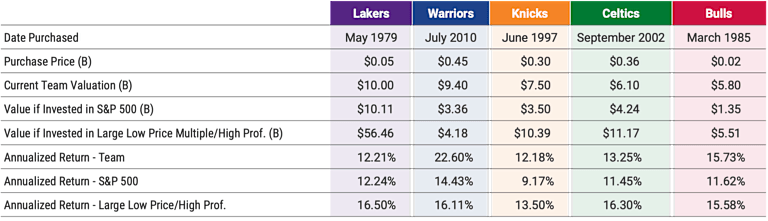
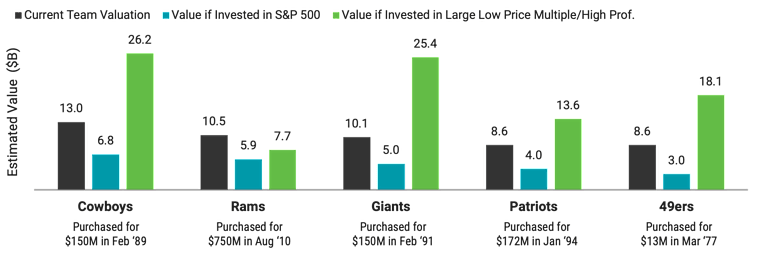
Figure 3 | Return on NFL Team Investments vs. U.S. Stocks
Panel A | Comparison of estimated values as of 6/30/25
Panel B | NFL Results Summary Table
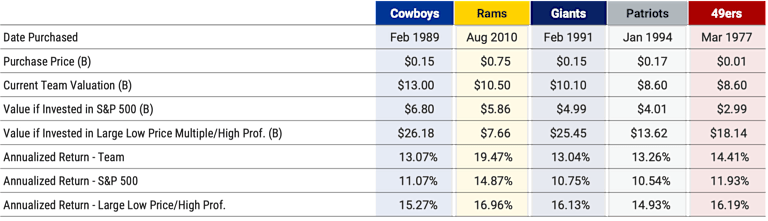
Figure 4 | Return on MLB Team Investments vs. U.S. Stocks
Panel A | Comparison of estimated values as of 6/30/25
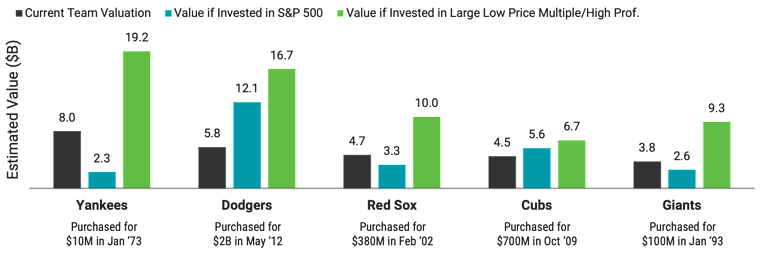
Panel B | NFL Results Summary Table
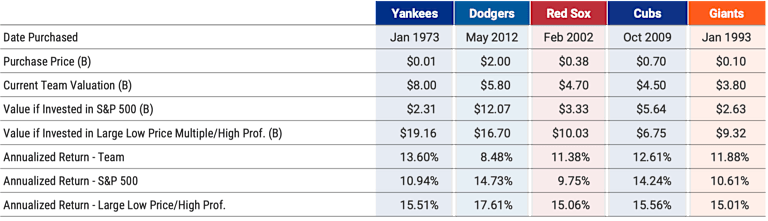
Data from the team purchase date through June 2025. Source for S&P 500 Index: Bloomberg. Source for large-caps with low price multiples and high profitability: Avantis Investors and Sunil Wahal, CRSP/Compustat, U.S. securities. Past performance is no guarantee of future results.
Large-caps generally represent the top 90% of the U.S. market capitalization. “Low Price Multiple” is defined as companies with a high book-to-market ratio. “High Profitability” is defined as companies with a high profits-to-book ratio. Team valuations are the latest estimates from CNBC’s 2025 team valuation report.
Sports vs. Stocks: What Investors Can Learn
In our view, it’s fun to consider these hypothetical scenarios and the context they offer investors. In reality, we know other variables would contribute to the total value of owning a professional sports team, like the potential utility and fulfillment that might come from the position and its celebrated status.
Team owners might also receive dividends over time that aren’t publicly disclosed and can’t be considered in our estimates of their return. That income matters. However, it can be argued that for many team owners in the analysis, it’s unlikely that component of their total return could overcome the outperformance observed from holding public stocks with attractive valuations.
Ultimately, the goal of the analysis is more about what it can offer everyday investors and less about the level of precision in the data. We believe it’s a great example highlighting that we don’t have to be billionaires to have access to sound investments and good long-term outcomes.
While we may read about seemingly massive absolute dollar returns from wealthy individuals’ investments in private entities like sports teams, the rates of return they receive may often be no better than what we can expect to receive from holding public stocks over time.
Further, as momentum builds for retail investors to access private markets (in some cases, even making it possible to invest small amounts in sports teams), it’s useful to remember that these investment options often come with other attributes not always mentioned in stories about big paydays.
Private investments tend to have much higher fees, lower liquidity (e.g., selling your investments may only be possible periodically rather than daily in the case of public markets), and without daily mark-to-market pricing, investors can often believe a private investment has lower volatility than is reality (e.g., volatility appears low simply because it’s infrequently valued).
The point is not that investing in sports teams, if you have the means, or allocating to other private investment options, is inherently a poor choice. What we take from the data is that, for many investors, the opportunity provided by public markets may be all they need to reach their goals.
Explore More Insights
Glossary
A payment of a company's earnings to stockholders as a distribution of profits.
Liquidity describes the degree to which an asset or security can be quickly bought or sold in the market without affecting the asset's price.
The S&P 500® Index is composed of 500 selected common stocks most of which are listed on the New York Stock Exchange. It is not an investment product available for purchase.
Considering only the estimated value of the Lakers in 1979 ($16 million), that amount invested in the S&P 500 Index would have grown to $3.3 billion between May 1979 and June 2025. The same amount invested in large-caps with low price multiples and high profitability would have grown to $18.2 billion.
Investment return and principal value of security investments will fluctuate. The value at the time of redemption may be more or less than the original cost. Past performance is no guarantee of future results.
This material has been prepared for educational purposes only. It is not intended to provide, and should not be relied upon for, investment, accounting, legal or tax advice.
The opinions expressed are those of the investment portfolio team and are no guarantee of the future performance of any Avantis Investors portfolio.