The State of Emerging Markets in 2026

Key Takeaways
Emerging markets (EM) represent a major share of global market cap and show stronger growth trends than developed economies.
Wide dispersion in EM country outcomes shows why focusing on just one market can increase risk.
Historically, EM companies with strong fundamentals and low prices have tended to deliver higher returns over time.
It was a banner year for non-U.S. stocks in 2025. Based on MSCI indexes in terms of the U.S. dollar (USD), both non-U.S. developed and emerging markets returned more than 30% for the year, sharply outperforming the U.S. market. The S&P 500® Index return was just shy of 18% in 2025.
It was a welcome outcome for those who have maintained an allocation to non-U.S. stocks through past years. But that’s a big part of the logic for holding both developed and emerging markets instead of just U.S. stocks: It’s unknown which will have higher returns in any given year, and holding a diversified portfolio ensures you’ve always got at least a piece of the winner.
Others who missed out on non-U.S. stocks’ big year may be wondering whether an allocation to non-U.S. stocks, including emerging markets, has merit today.
This article explains why we believe this asset class can play a valuable, long-term role in an overall equity allocation and offers key considerations for investors seeking EM exposure.
How Big Are Emerging Markets in 2026?
The potential benefits of portfolio diversification have been recognized since at least the pioneering work of Markowitz in the 1950s, and the substantial size of emerging markets today indicates they provide a valuable opportunity to enhance diversification for investors whose allocations include only developed markets.
As of the end of 2025, emerging markets accounted for more than 11% of global market capitalization, as measured by the MSCI ACWI IMI. In terms of the number of companies, emerging markets make up more than 37% of the world (over 3,000 of the about 8,200 companies in the MSCI ACWI IMI at the end of the last year). See Figure 1.
Figure 1 | Emerging Markets Are a Sizable Slice of the World Pie
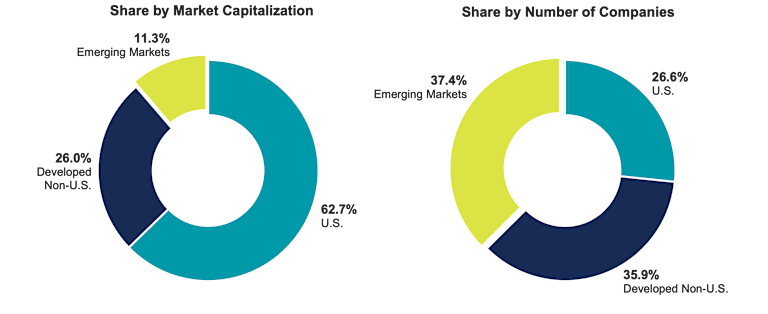
Data as of 12/31/2025. Source: Morningstar. Data represented by MSCI ACWI IMI.
Emerging countries also have a significant impact on global economic output and growth. Of the five largest economies today, two are classified as emerging: China and India. These two nations have higher gross domestic product (GDP) than the U.K., France and Italy, which rank as the 6th through 8th largest economies, respectively.
Focusing on GDP growth, Figure 2 presents the International Monetary Fund’s (IMF’s) estimated 2025 GDP growth for advanced and emerging economies, along with their projections for 2026 and 2027. We observe generally higher GDP growth rates among emerging economies in 2025 and higher projected growth over the next few years.
Population data also reveals an interesting story. The IMF estimates the world's current population at 8.1 billion, with 7 billion from emerging economies. That’s 86% of the global population!
Figure 2 | Emerging Economies Exhibited Higher GDP Growth Than Advanced Economies in 2025, Higher Forward Projections as Well
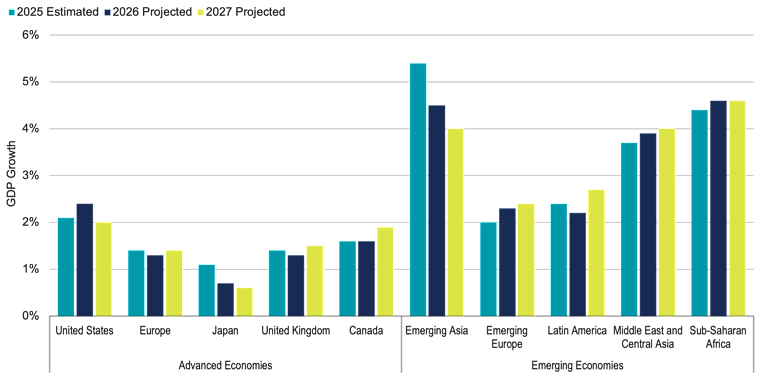
Data as of 12/31/2025. Source: International Monetary Fund.
The Evolution of EM Country Weights
Investors may at times view emerging markets as a homogeneous unit. However, there’s a lot under the hood, including 24 different countries today, according to MSCI classifications. Moreover, this composition changes over time.
In Figure 3, we show the 10 largest countries in the MSCI Emerging Markets IMI from 15 years ago and how they have shifted over that period through today. Since the end of 2010, China has remained the largest emerging market country, but it grew to nearly 40% of the index by late 2020 and is now down to about 25% of the universe.
Russia has dropped from the 7th-largest country in 2010 to no longer being classified as an investable emerging market (shown in red in Panel B). Taiwan and India have each increased their share (ranking in the top three today and not far behind China), while Brazil’s share is less than a third of what it was 15 years ago. The United Arab Emirates (UAE) was added as a newly classified emerging market in 2014 and Saudi Arabia in 2019. Both now rank in the top 10 (shown in green in Panel B).
Figure 3 | Evolution of the Largest Emerging Markets Over the Last 15 Years
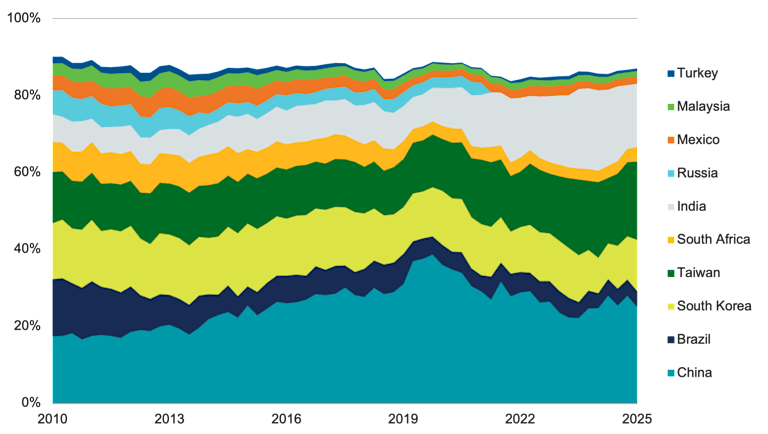
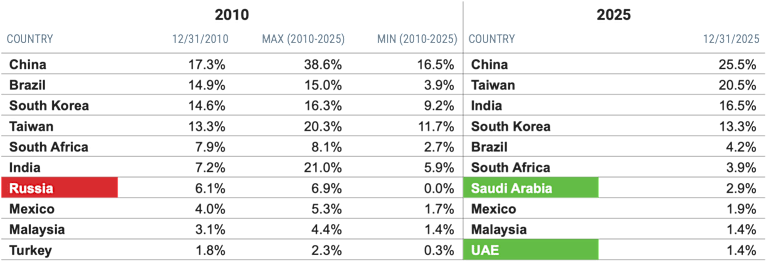
Data from 12/31/2010 - 12/31/2025. Source: Morningstar.
A benefit of gaining exposure across the 20+ EM countries is not just access to more companies. They also offer diversification across varying valuation profiles and, in many cases, more attractive valuations than much of the developed markets. Valuations simply refer to comparing a company's price to its fundamentals, such as earnings or equity.
In Figure 4, we show that today the price-to-earnings (P/E) ratio for emerging markets collectively (MSCI Emerging Markets IMI) is considerably lower than that of U.S. stocks (S&P 500) and the MSCI World IMI, which represents all developed markets.
P/E ratios among today’s 10 largest EM countries vary, but all are currently lower than U.S. stocks. Beyond diversification opportunities, lower valuations in emerging markets may offer greater upside potential.
Figure 4 | Emerging Markets Valuations Are Noticeably Lower Than Developed Markets
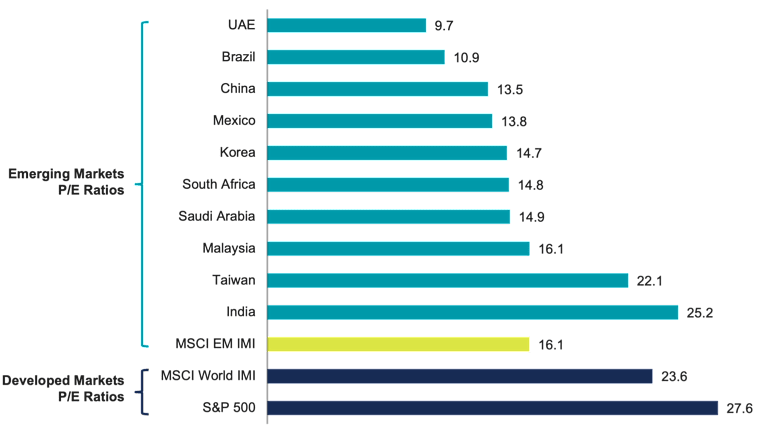
Source: Morningstar. Data as of 12/31/2025. Individual countries are represented by their respective MSCI IMI indexes, which are all market cap-weighted indexes capturing both large and small capitalization companies within each country. There are two exceptions (Saudi Arabia and UAE) for which IMI indexes are not available and MSCI standard, large-cap indexes are used.
Why Diversification in Emerging Markets Is Critical
Given the many markets within the emerging category and their different characteristics, investors may be tempted to pick one or a few they find most attractive. Historical returns of individual EM countries highlight why we believe it’s wise to maintain broad diversification across countries.
Figure 5 shows returns for the last 15 years for the 10 largest emerging markets today that have been included in the MSCI Emerging Markets IMI for the full period (i.e., more recent additions UAE and Saudi Arabia don’t have the necessary return history). The quilt chart shows the high year-to-year variability in single-country returns. We see no discernible patterns in yearly rankings of returns.
However, we find that returns are consistently widely dispersed across countries within each year. Taking the difference between the highest and lowest country return by year, there’s a range over the 15 years as high as about 93% and as low as just under 24%. These are large differences in returns for a single year.
The data show that investors who concentrate in one or a few EM countries face a significant risk of ending up worse off than the total EM portfolio. Importantly, in our view, the benefits of diversification don’t end with countries. Diversifying across, as well as within, countries can help to mitigate the effect of any single country, sector or company on overall outcomes.
Figure 5 | Annual Returns Among EM Countries Vary Widely
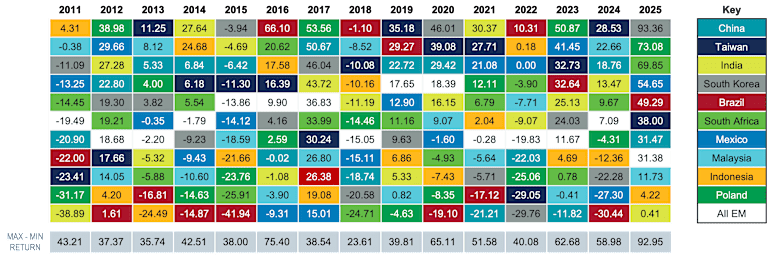
Data from 1/1/2011 – 12/31/2025. Data in USD. Source: Morningstar. Past performance is no guarantee of future results.
Valuations Among Companies Within Emerging Markets Also Matter
Implementing broadly diversified EM exposure, however, doesn't mean investors have no chance to outperform market benchmarks. This is because not all companies have the same expected returns (see Glossary below). If we have good information about which ones may have higher expected returns than others, we can emphasize them in a diversified portfolio to pursue better outcomes.
Investors’ ability to identify companies expected to perform better comes back to valuations. We see evidence of this in Figure 6.
Figure 6 | Company Valuations Make a Difference in Emerging Markets
Data from 6/30/1991 – 12/31/2025. Data in USD. Source: Ken French Data Library. Past performance is no guarantee of future results.
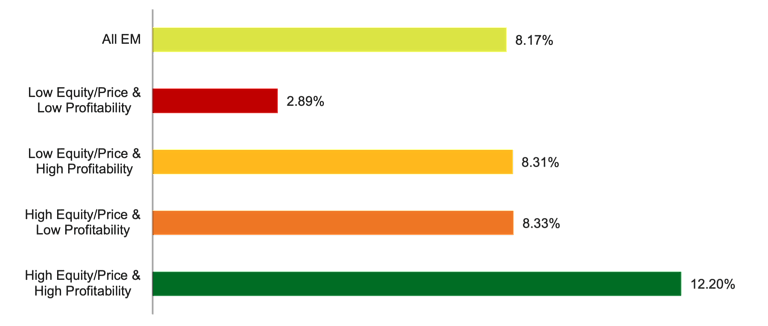
The chart shows annualized returns for all EM companies from mid-1991 through 2025. This is compared with four market segments, sorted by combinations of high or low equity-to-price and profitability. Equity is defined as a company’s assets minus its liabilities on its balance sheet, while profitability comes from its income statement.
Companies with high equity-to-price and high profitability have historically shown material outperformance versus the overall market. Companies with high equity-to-price but low profitability or high profitability but low equity-to-price (i.e., high prices) have both performed similarly to the market over time. Companies with low profitability and high prices have significantly underperformed the market and other segments.
These outcomes are logical. It makes sense that better returns are expected from companies with strong balance sheets (high equity) and high profitability that are still available at attractive prices. Even with solid fundamentals, the prices are low, indicating that the market is offering these companies at a significant discount and providing good value for investors.
When we look at how these companies have done historically over one- and three-year rolling periods since 1991, those with both high equity-to-price and high profitability have outperformed the full EM portfolio 76% and 87% of the time, respectively. We think that’s a good indication of an opportunity for added value.
The Crucial Role of EM Exposure in an Overall Equity Allocation
We believe the merits of maintaining EM exposure within a total equity allocation are sound. The potential diversification benefits they offer are valuable and can benefit investors during periods when emerging markets outperform developed markets — an occurrence we saw in 2025 and have also observed for prolonged periods in the past.
In our view, those who gain this exposure through solutions broadly diversified across countries, sectors and companies, combined with careful consideration of company valuations, are likely to be well-positioned over the long term.
Explore More Insights
Glossary
Expected Returns: Valuation theory shows that the expected return of a stock is a function of its current price, its book equity (assets minus liabilities) and expected future profits, and that the expected return of a bond is a function of its current yield and its expected capital appreciation (depreciation). We use information in current market prices and company financials to identify differences in expected returns among securities, seeking to overweight securities with higher expected returns based on this current market information. Actual returns may be different than expected returns, and there is no guarantee that the strategy will be successful.
A measure of the total economic output in goods and services for an economy.
An international organization that promotes global monetary and exchange stability, facilitates the expansion and growth of international trade, and assists in the establishment of a multilateral system of payments for transactions.
Market capitalization is the market value of all the equity of a company's common and preferred shares. It is usually estimated by multiplying the stock price by the number of shares for each share class and summing the results.
A free float-adjusted market capitalization-weighted index that is designed to measure the equity market performance of developed and emerging markets.
The MSCI ACW (All Country World) Investable Market Index (IMI) captures large, mid and small cap representation across 23 Developed Markets (DM) and 24 Emerging Markets (EM) countries. With 9,139 constituents, the index is comprehensive, covering approximately 99% of the global equity investment opportunity set.
Captures large, mid and small cap representation across emerging markets countries, covering approximately 99% of the free float-adjusted market capitalization in each country.
The MSCI World Investable Market Index (IMI) captures large, mid and small cap representation across developed markets countries. The index is comprehensive, covering approximately 99% of the global equity investment opportunity set. It is not possible to invest directly in an index.
The price of a stock divided by its annual earnings per share. These earnings can be historical (the most recent 12 months) or forward-looking (an estimate of the next 12 months). A P/E ratio allows analysts to compare stocks on the basis of how much an investor is paying (in terms of price) for a dollar of recent or expected earnings. Higher P/E ratios imply that a stock's earnings are valued more highly, usually on the basis of higher expected earnings growth in the future or higher quality of earnings.
A market-capitalization-weighted index of the 500 largest U.S. publicly traded companies. The index is widely regarded as the best gauge of large-cap U.S. equities.
International investing involves special risks, such as political instability and currency fluctuations. Investing in emerging markets may accentuate these risks.
Diversification does not assure a profit nor does it protect against loss of principal.
Investment return and principal value of security investments will fluctuate. The value at the time of redemption may be more or less than the original cost. Past performance is no guarantee of future results.
This material has been prepared for educational purposes only. It is not intended to provide, and should not be relied upon for, investment, accounting, legal or tax advice.
The opinions expressed are those of the portfolio team and are no guarantee of the future performance of any Avantis fund.
References to specific securities are for illustrative purposes only and are not intended as recommendations to purchase or sell securities. Opinions and estimates offered constitute our judgment and, along with other portfolio data, are subject to change without notice.
©2026 Morningstar, Inc. All Rights Reserved. Certain information contained herein: (1) is proprietary to Morningstar and/or its content providers; (2) may not be copied or distributed; and (3) is not warranted to be accurate, complete or timely. Neither Morningstar nor its content providers are responsible for any damages or losses arising from any use of this information.