What Investors Can Learn From 2025 Market Trends

Key Takeaways
The journey of U.S. stocks in 2025 highlighted resilience, with sharp recoveries following frequent headline-driven swings.
Non-U.S. stocks posted their largest outperformance over their U.S. peers in the past 15 years, highlighting global strength.
2025 was a banner year for bonds, as yields declined and global corporates delivered even higher returns.
It was another remarkable year for the U.S. stock market in 2025. The S&P 500® Index rose nearly 18% with 46 new all-time highs during the year!
While undoubtedly a good outcome, a single return figure fails to capture the full experience of investors. Figure 1 helps fill in the gaps, capturing major headlines from the year atop the cumulative return of the S&P 500.
What’s clear is that the strong market performance during the year occurred despite numerous examples of news contributing to investor uncertainty, and, critically, earning these returns required discipline.
Figure 1 | S&P 500’s 2025 Journey: Resilience Amid Headlines and Volatility
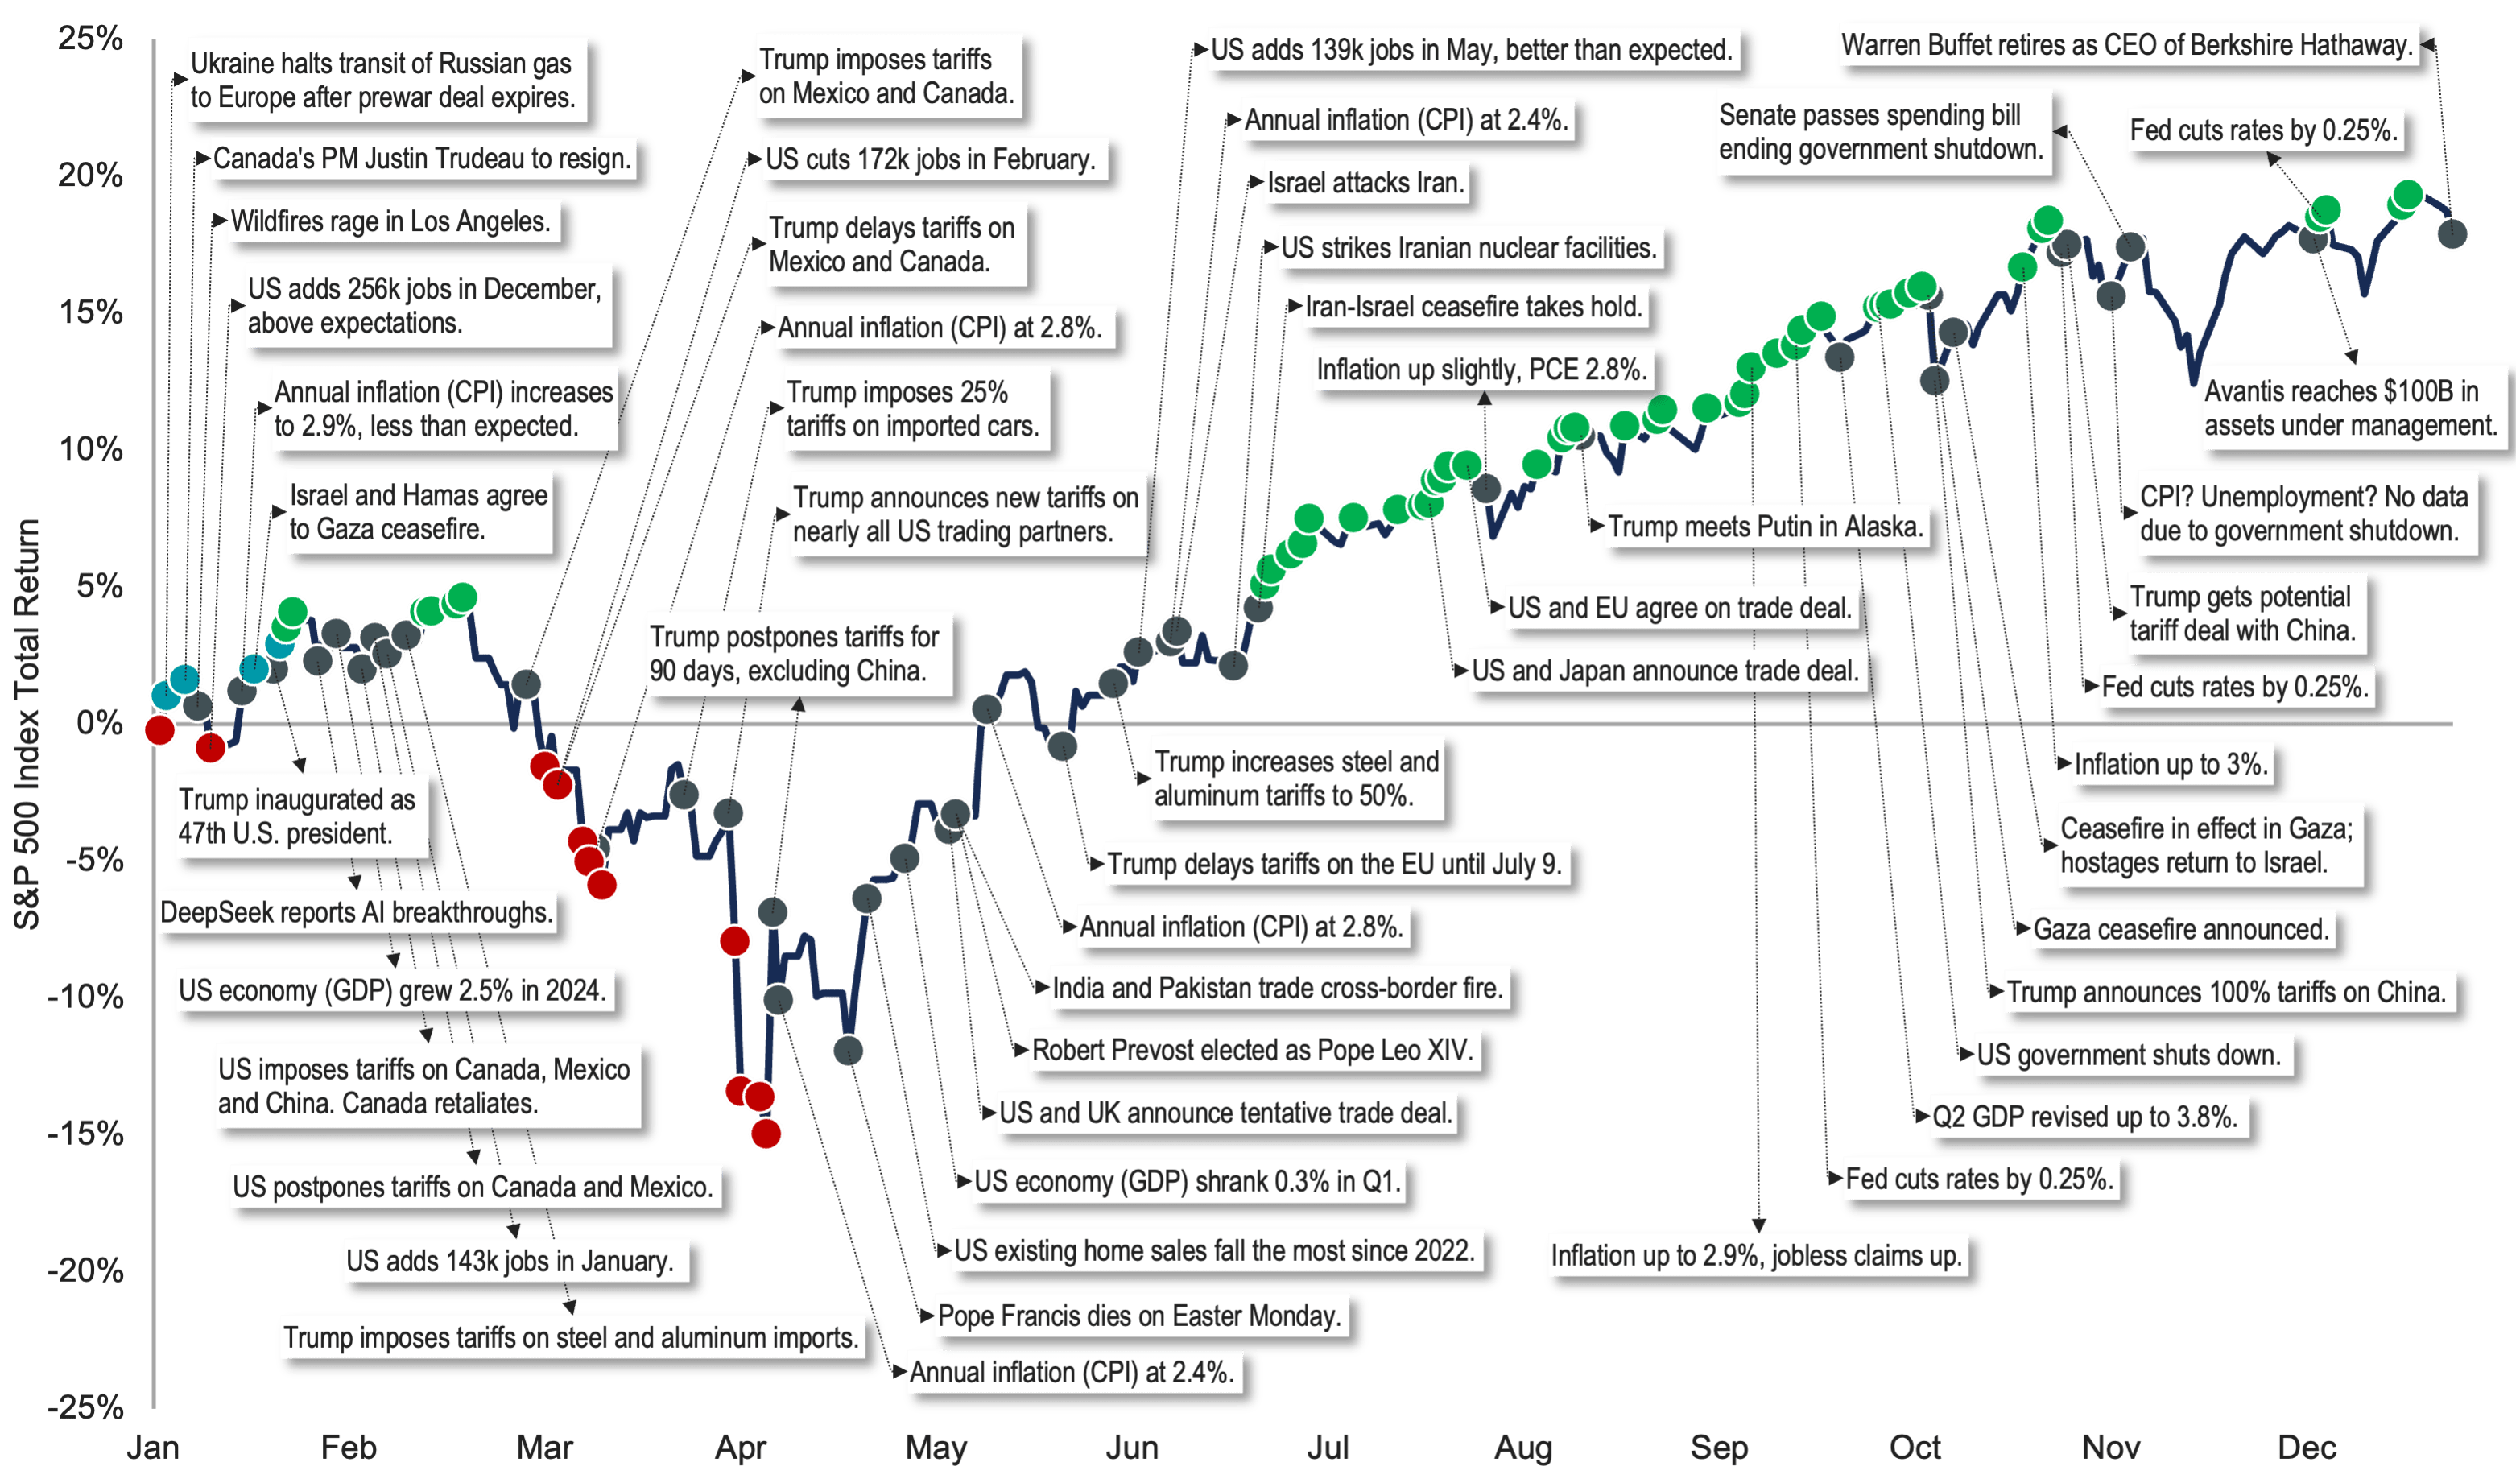
Data from 1/1/2025 - 12/31/2025. Source: FactSet, Avantis Investors. Past performance is no guarantee of future results.
Consider that between late February and early April, the S&P 500 fell nearly 19% based on end-of-day closing prices. On April 7, the index briefly dipped into bear market territory, with a decline of more than -21% from its late February high.
During that drawdown period, the index declined 6% in a single trading day, following the announcement of new tariffs on nearly all U.S. trading counterparts on April 3. When most of those new tariffs were paused less than a week later, the market surged almost 10% in one day, kick-starting a recovery that took just 54 days to claw back losses from the drawdown.
All told, the index rose about 39% from April 9 through the end of the year. Investors who stayed the course through those trying times were likely rewarded. Figure 2 illustrates the ups and downs that investors faced in the U.S. market during 2025.
Figure 2 | S&P 500 Index by the Numbers in 2025
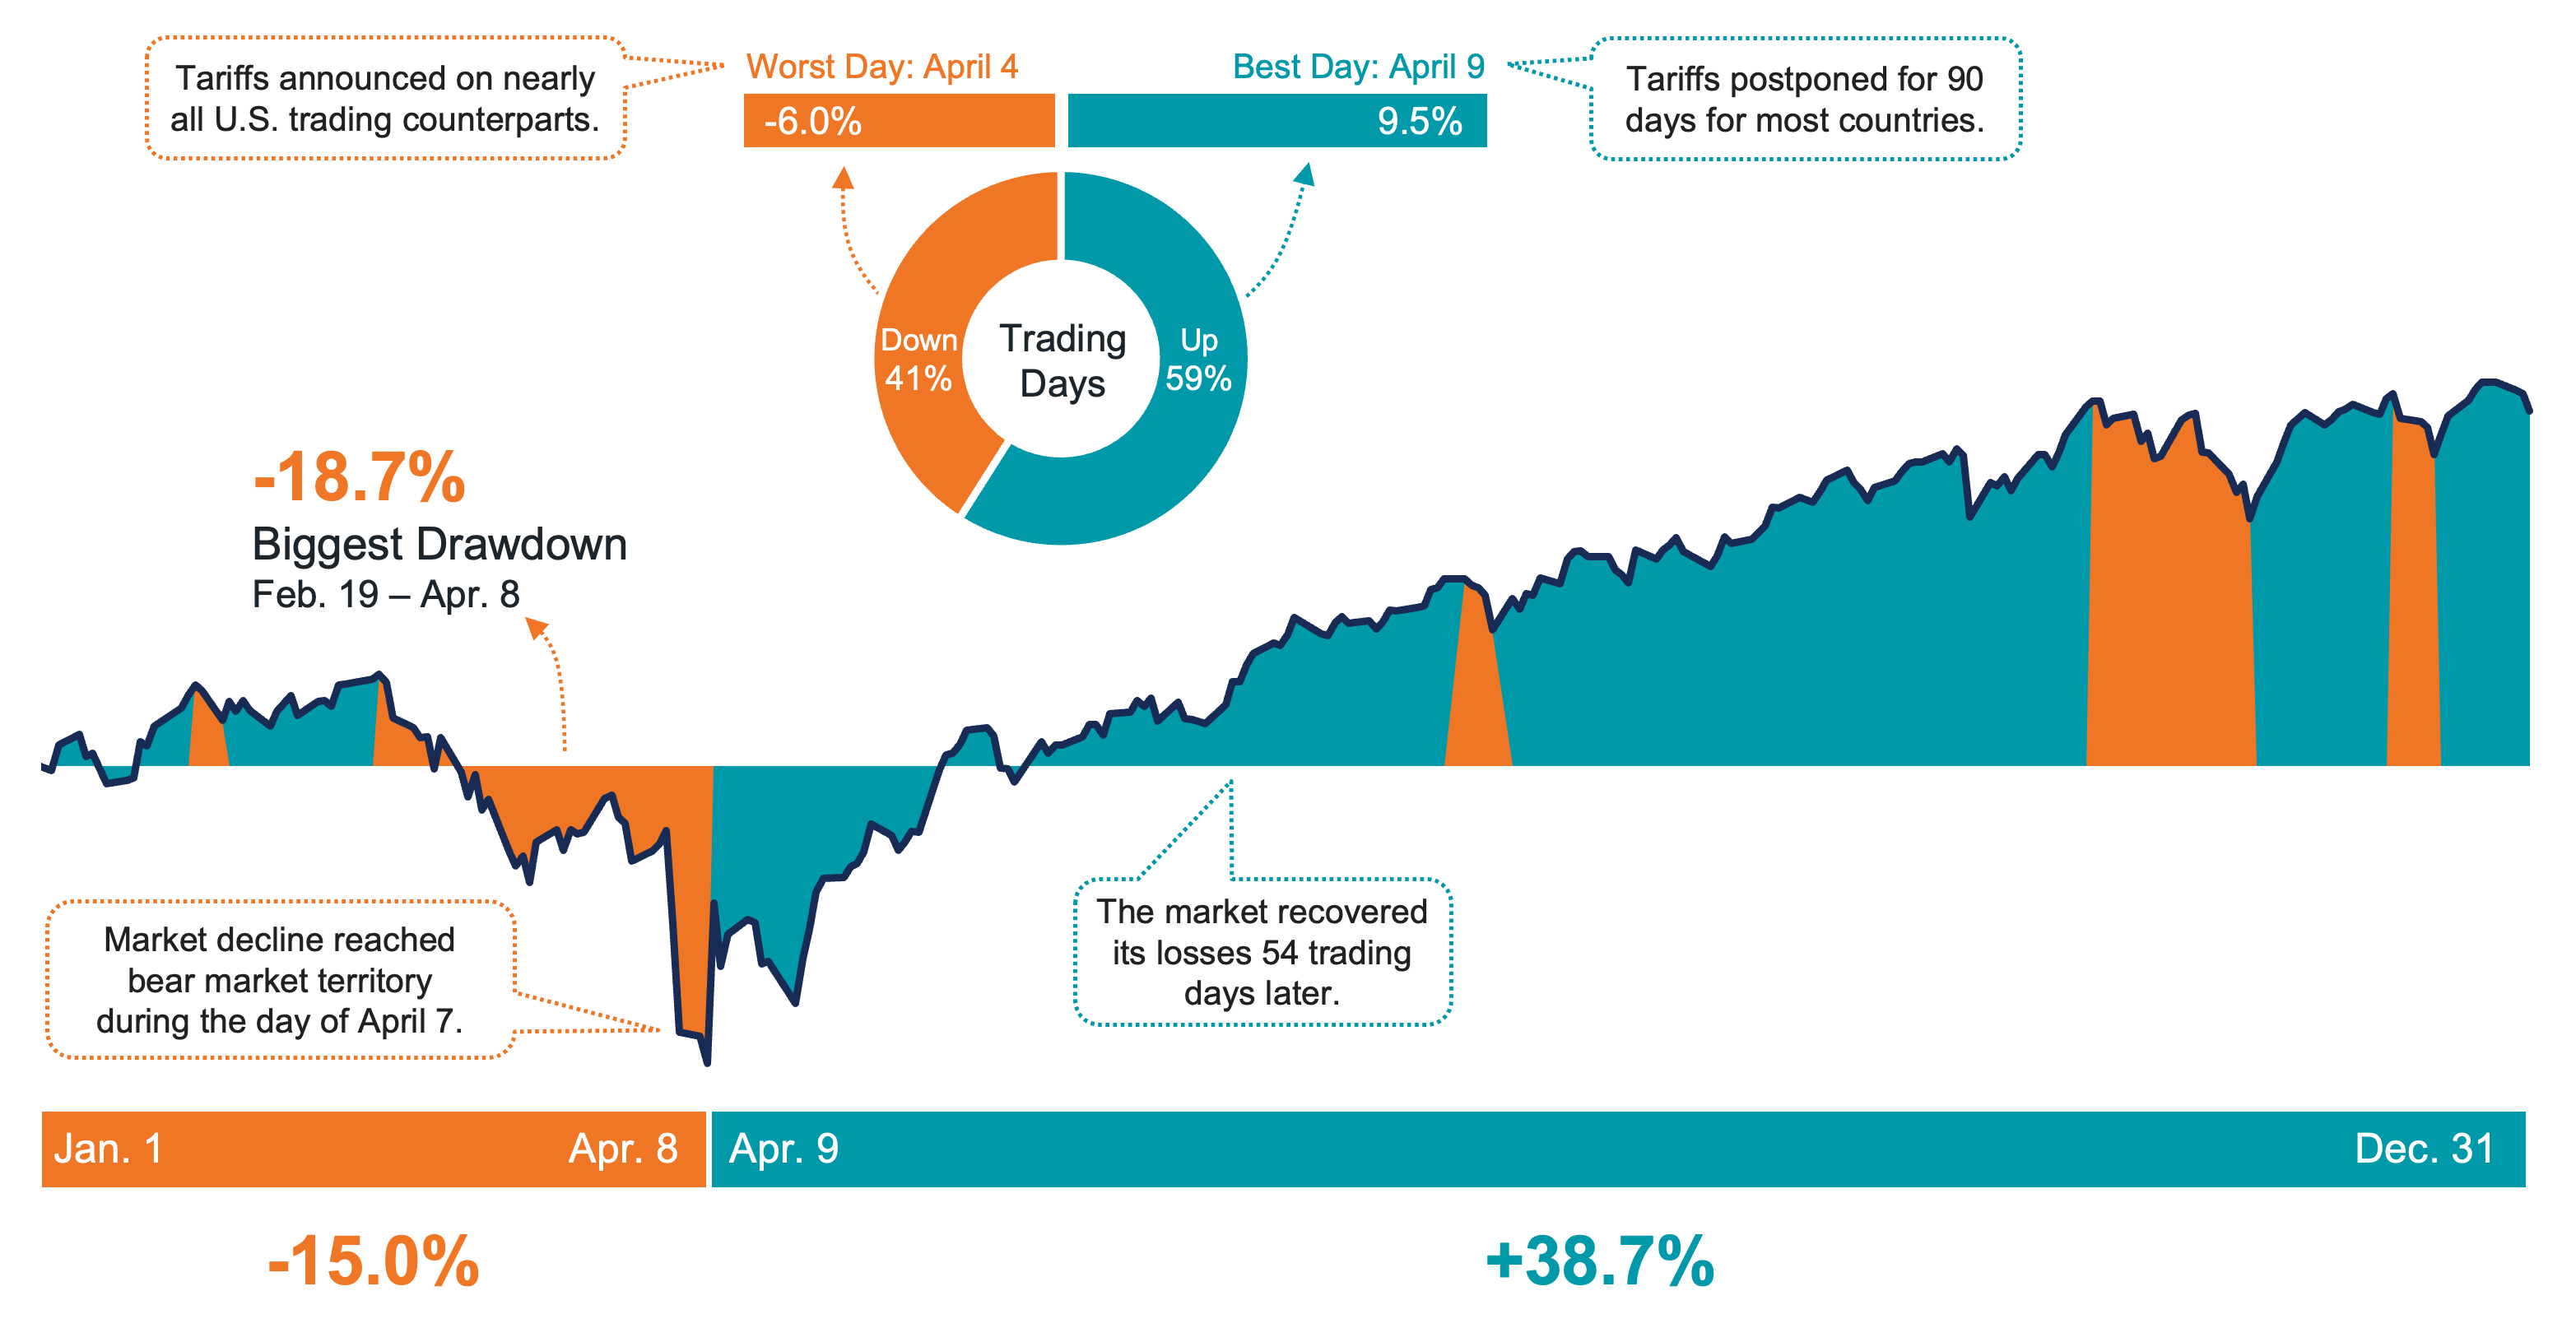
Data from 1/1/2025 - 12/31/2025. Source: Bloomberg, Avantis Investors. Past performance is no guarantee of future results.
But no recap of stocks in 2025 would be complete without discussing the meaningful outperformance of non-U.S. markets.
Not only did non-U.S. stocks best their U.S. peers for the first time since 2022, but the MSCI ACWI ex USA Index, which includes both non-U.S. developed and emerging markets, beat the S&P 500 Index by about 14.5% in 2025, as shown in Figure 3. That’s by far the highest margin of outperformance for non-U.S. stocks in the past 15 years. The next closest was a little more than 5% in 2017.
Furthermore, relative outperformance wasn’t driven exclusively by developed or emerging markets or sub-asset classes within these regions. Many segments of non-U.S. stocks outperformed the S&P 500 by posting significantly higher returns during the year.
Figure 3 | Non-U.S. Stocks Stole the Show in 2025
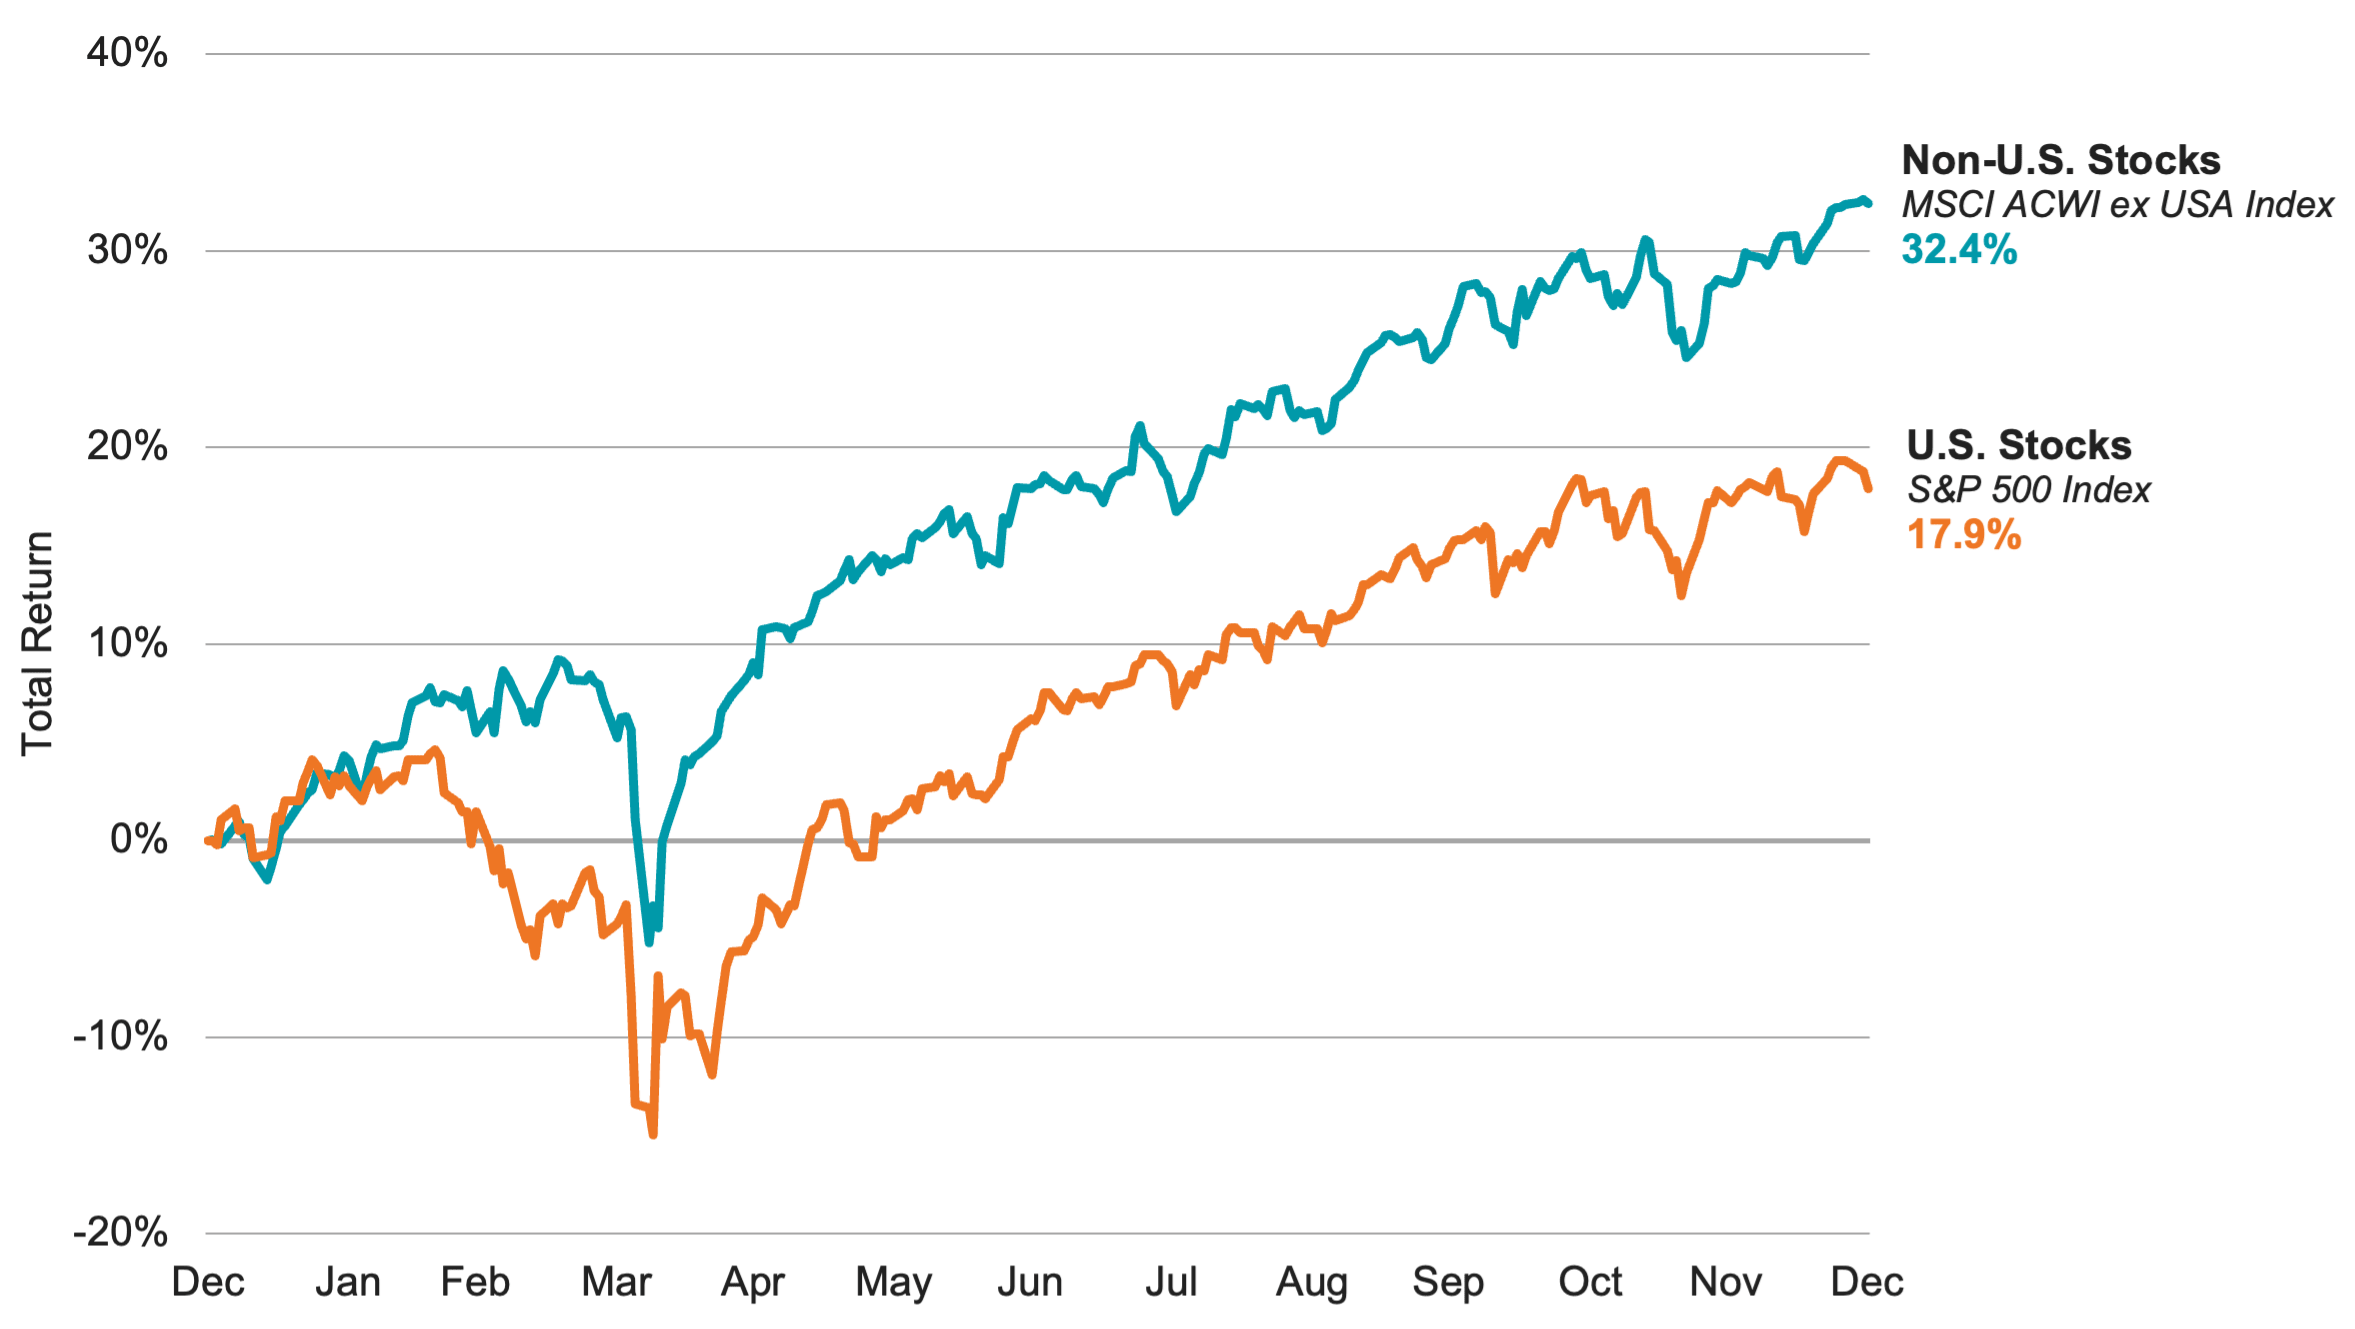
Data from 1/1/2025 - 12/31/2025. Source: Bloomberg, Avantis Investors. Past performance is no guarantee of future results.
Figure 4 presents a selection of non-U.S. market indexes and their returns in 2025, compared to the U.S. market. A popular U.S. dollar index is also included, showing that the U.S. dollar (USD) declined during the year relative to major non-U.S. currencies.
Figure 4 | Many Non-U.S. Market Asset Classes Outperformed U.S. Stocks in 2025
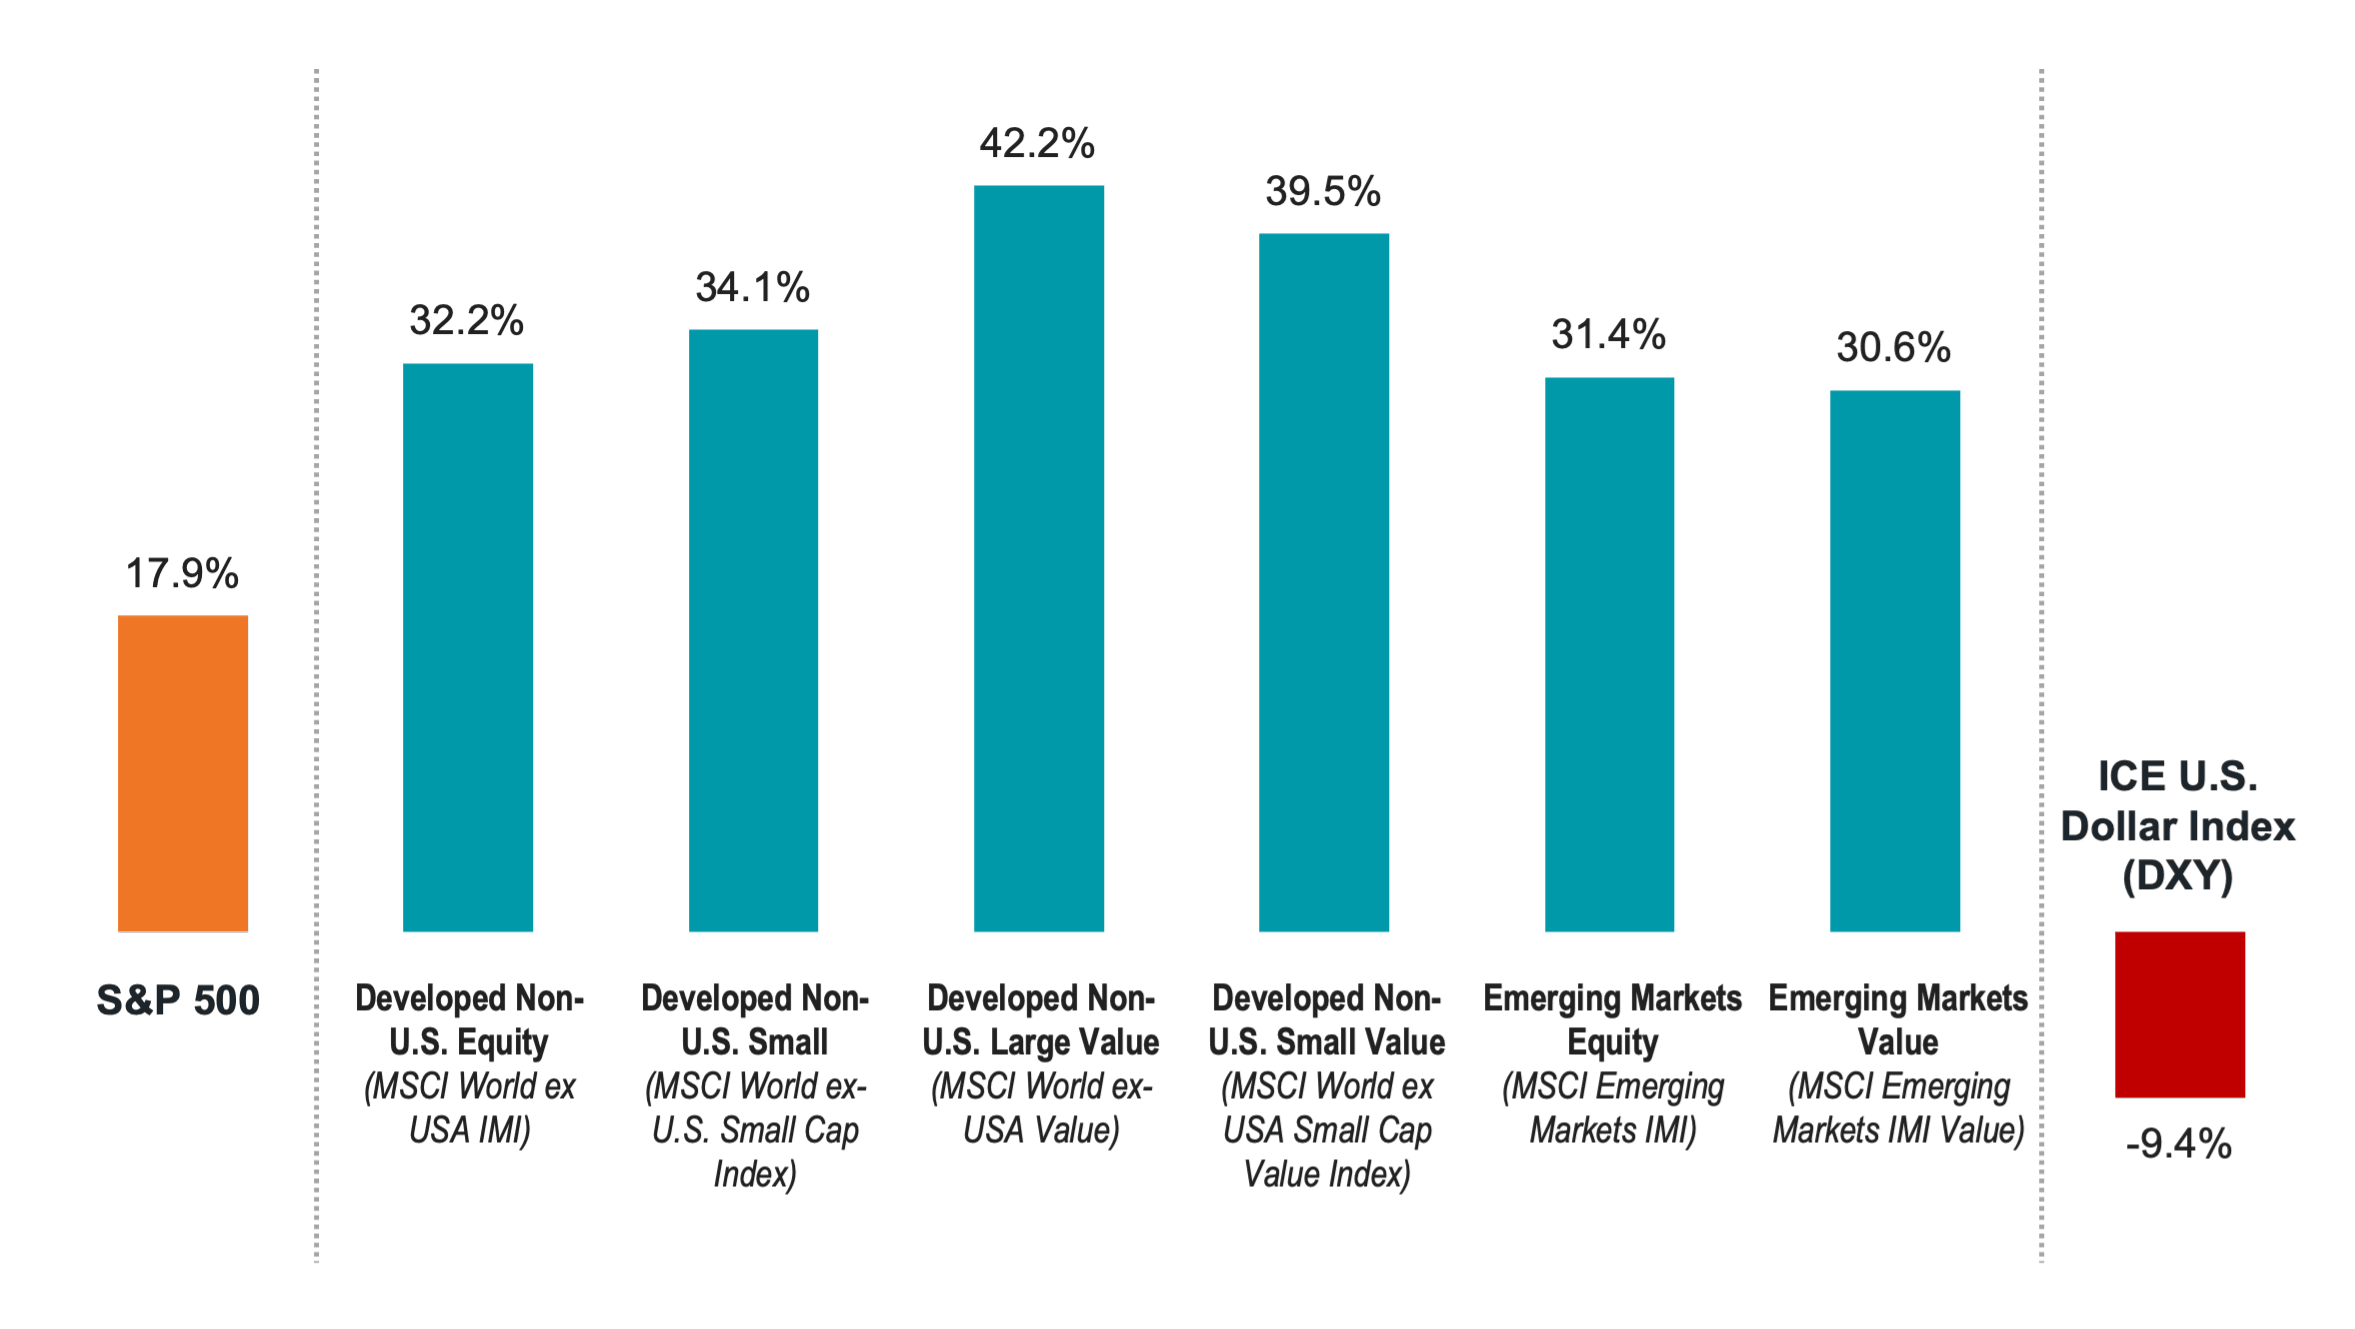
Data from 1/1/2025 - 12/31/2025. Source: Bloomberg, Avantis Investors. Past performance is no guarantee of future results.
A declining dollar aids the returns of non-U.S. market exposure held in USD, but the data indicates that it didn’t explain all outperformance from non-U.S. markets during the year. In fact, the USD’s decline was concentrated in the first half of the year, with a modest rise in the second half.
The results are a welcome reminder of the potential value of globally diversified portfolios. And investors who focused on companies in non-U.S. markets with higher profits and lower relative prices generally fared even better. For example, within developed non-U.S. small-cap stocks, one definition of value — companies with both low prices relative to their equity and higher profitability — rose nearly 50% in 2025!
Bond Market Highlights
The good news in 2025 wasn’t limited to equity investors. The bond markets broadly delivered strong returns of their own. In a year when the Federal Reserve (Fed) voted for three quarter-point cuts to the federal funds rate, U.S. yield curves notably steepened during the year, as shown in Figure 5.
Figure 5 | Yield Curves Steepened in 2025
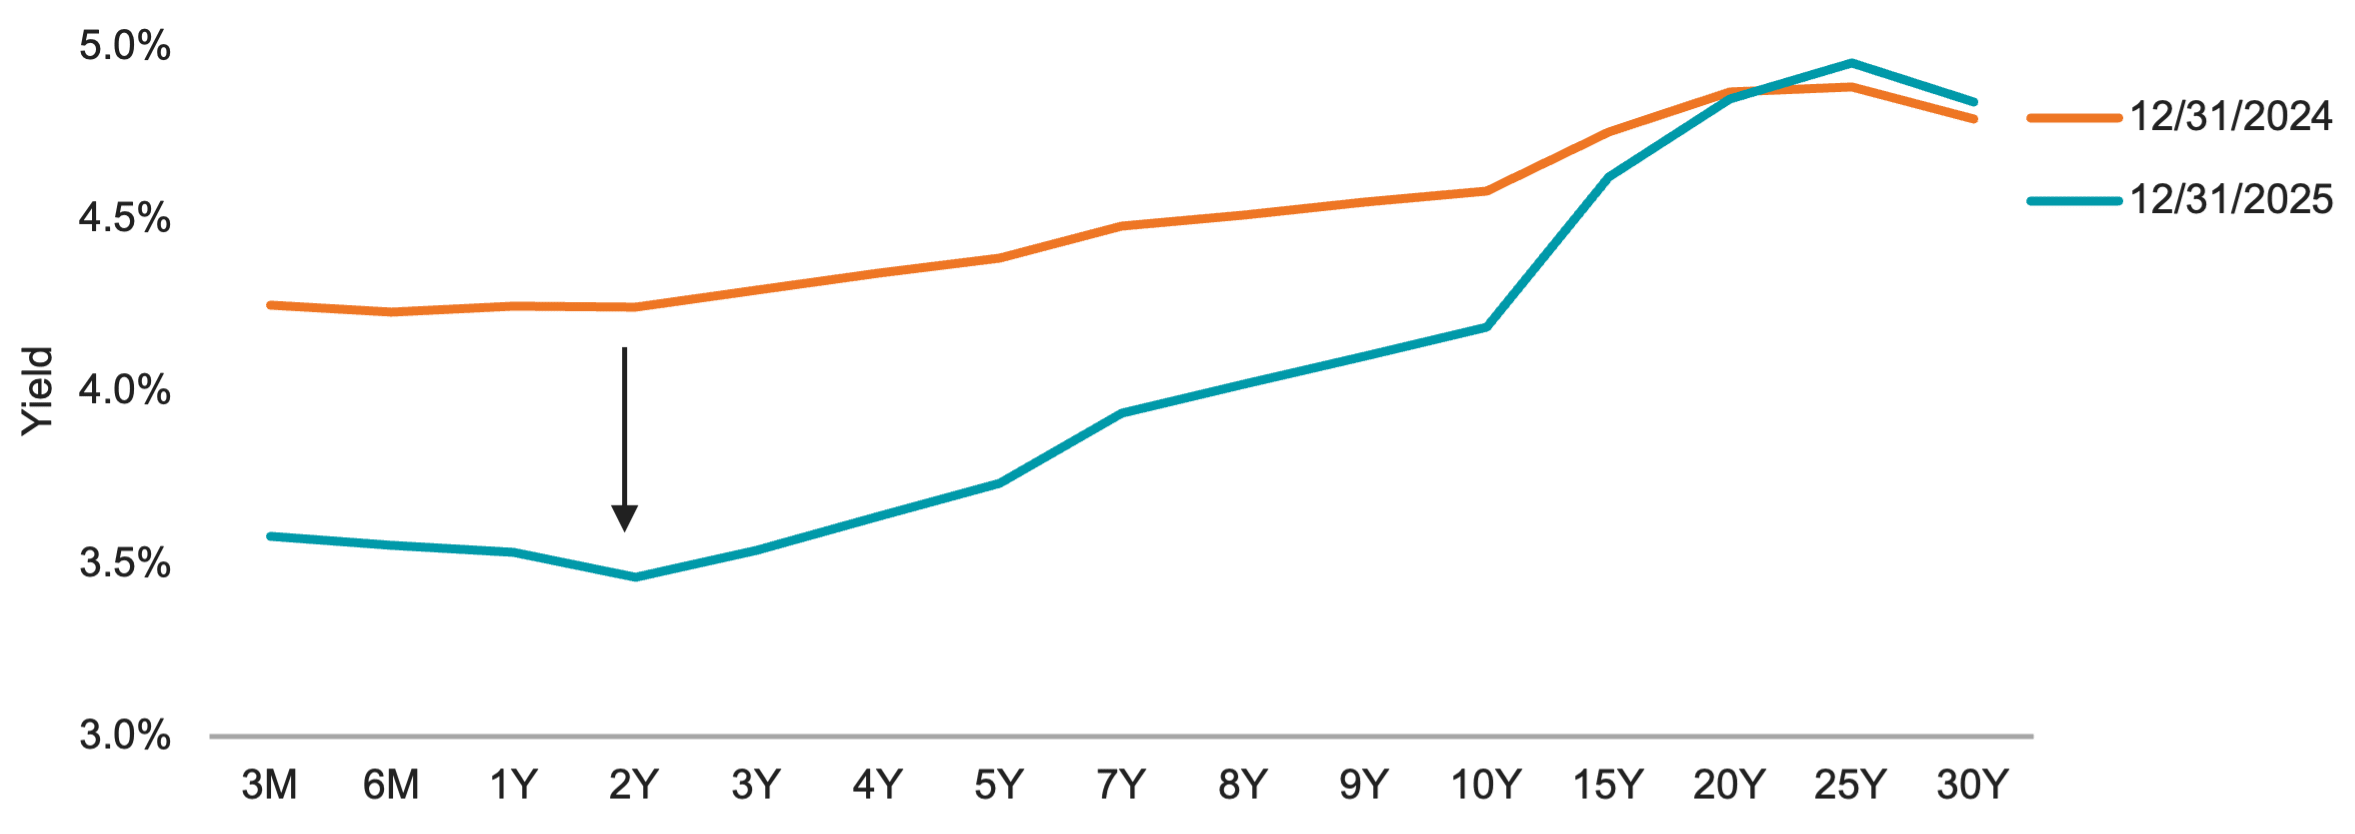
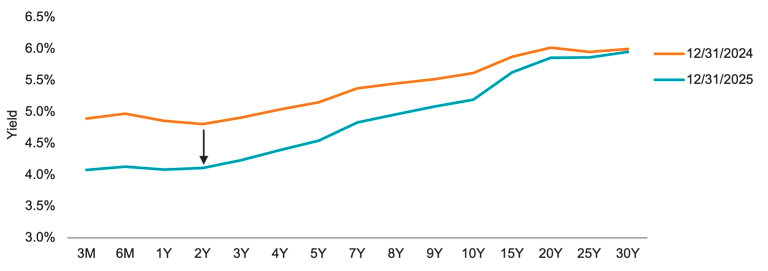
Data for both charts from 12/31/2024 - 12/31/2025. Source: Bloomberg. Past performance is no guarantee of future results.
With yields generally declining in 2025 outside of some of the longest-maturity Treasuries, the U.S. bond market, as measured by the Bloomberg U.S. Aggregate Bond Index, posted its highest return since 2020, at nearly 7.5%.
As Figure 6 illustrates, the global bond market, and especially global corporates, enjoyed even higher returns on the year.
Figure 6 | A Banner Year for U.S. and Global Bonds in 2025
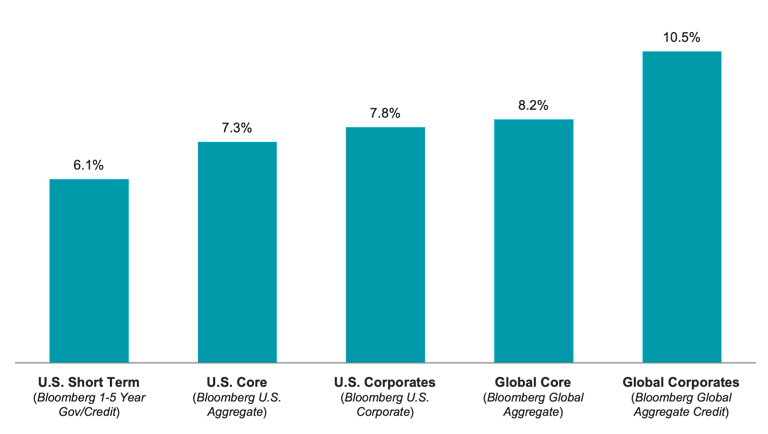
Data from 1/1/2011 - 12/31/2025. Source: Bloomberg, Avantis Investors. Past performance is no guarantee of future results.
2026 Outlook: Applying 2025 Market Lessons
By many measures, 2025 was a good year for investors. It’s okay to feel pleased about that, while also recognizing that the end of a calendar year doesn’t necessarily resolve any uncertainty or anxiety investors may have experienced as the year drew to a close.
For example, we can probably expect to hear more discussion from financial news outlets in 2026 about the labor market, inflation, interest rate expectations, the performance of companies heavily invested in artificial intelligence, and so on. There will also be news that no one is even thinking about today.
However, the results of 2025, like those of many past years, remind us that there will always be reasons to worry about our investments, and that doesn’t require that we experience disappointing outcomes in our portfolios. The key is to do our best to let go of short-term concerns and focus on the long term.
Investing for the future is a journey. It’s a story that isn’t told in a day, a month or a year. Keeping that in mind is a sound first step for the new year.
Explore More Insights
Glossary
A broad-based measure of the global investment-grade fixed income markets. The three major components of this index are the U.S. Aggregate, the Pan-European Aggregate, and the Asian-Pacific Aggregate Indices. The index also includes Eurodollar and Euro-Yen corporate bonds, Canadian government, agency and corporate securities, and USD investment grade 144A securities.
Contains publicly issued corporate and specified foreign debentures and secured notes that meet the specified maturity, liquidity and quality requirements.
A component of the U.S. Government/Credit Bond Index, which includes Treasury and agency securities (U.S. Government Bond Index) and publicly issued U.S. corporate and foreign debentures and secured notes (U.S. Credit Bond Index). The bonds in the index are investment-grade with a maturity between one and five years.
Represents securities that are taxable, registered with the Securities and Exchange Commission, and U.S. dollar-denominated. The index covers the U.S. investment-grade fixed-rate bond market, with index components for government and corporate securities, mortgage pass-through securities, and asset-backed securities.
Consists of publicly issued U.S. corporate and specified foreign debentures that are registered with the Securities and Exchange Commission and meet specific maturity, liquidity, and quality requirements.
CPI is the most commonly used statistic to measure inflation in the U.S. economy. Sometimes referred to as headline CPI, it reflects price changes from the consumer's perspective. It's a U.S. government (Bureau of Labor Statistics) index derived from detailed consumer spending information. Changes in CPI measure price changes in a market basket of consumer goods and services such as gas, food, clothing, and cars. Core CPI excludes food and energy prices, which tend to be volatile.
Measurements of credit quality (defined below) provided by credit rating agencies (defined below). Those provided by Standard & Poor's typically are the most widely quoted and distributed, and range from AAA (highest quality; perceived as least likely to default) down to D (in default). Securities and issuers rated AAA to BBB are considered/perceived to be "investment-grade"; those below BBB are considered/perceived to be non-investment-grade or more speculative.
The federal funds rate is an overnight interest rate banks charge each other for loans. More specifically, it's the interest rate charged by banks with excess reserves at a Federal Reserve district bank to banks needing overnight loans to meet reserve requirements. It's an interest rate that's mentioned frequently within the context of the Federal Reserve's interest rate policies. The Federal Reserve's Open Market Committee (defined below) sets a target for the federal funds rate (which is a key benchmark for all short-term interest rates, especially in the money markets), which it then supports/strives for with its open market operations (buying or selling government securities).
The Fed is the U.S. central bank, responsible for monetary policies affecting the U.S. financial system and the economy.
A measure of the total economic output in goods and services for an economy.
A measure of the value of the United States dollar relative to a basket of foreign currencies. The U.S. Dollar Index goes up when the U.S. dollar gains strength (value) compared to other currencies.
A free float-adjusted market capitalization-weighted index that is designed to measure the equity market performance of developed and emerging markets, excluding the United States.
Captures large, mid and small cap representation across emerging markets countries, covering approximately 99% of the free float-adjusted market capitalization in each country.
The MSCI Emerging Markets Investable Market Value Index (IMI) captures large, mid and small cap representation across 27 Emerging Markets (EM) countries including Argentina, Brazil, Chile, China, Colombia, Czech Republic, Egypt, Greece, Hungary, India, Indonesia, Korea, Kuwait, Malaysia, Mexico, Pakistan, Peru, Philippines, Poland, Qatar, Russia, Saudi Arabia, South Africa, Taiwan, Thailand, Turkey and United Arab Emirates. With 3,228 constituents, the index covers approximately 99% of the free float-adjusted market capitalization in each country.
Captures large, mid and small cap representation across developed markets countries (excluding the United States), covering approximately 99% of the free float-adjusted market capitalization in each country.
Captures small cap representation across developed markets countries (excluding the United States), covering approximately 14% of the free float-adjusted market capitalization in each country.
Based on a traditional market cap weighted parent index (MSCI World ex -USA Small Cap Index), which includes small cap stocks across developed markets countries (excluding the United States). The MSCI World ex USA Small Cap Value Weighted Index reweights each security of the parent index to emphasize stocks with lower valuations. Index weights are determined using fundamental accounting data — sales, book value, earnings and cash earnings — rather than market prices.
The MSCI World ex-USA Value Index captures large and mid-cap securities exhibiting overall value style characteristics across 22 of 23 Developed Markets countries including Australia, Austria, Belgium, Canada, Denmark, Finland, France, Germany, Hong Kong, Ireland, Israel, Italy, Japan, Netherlands, New Zealand, Norway, Portugal, Singapore, Spain, Sweden, Switzerland and the UK. The value investment style characteristics for index construction are defined using three variables: book value to price, 12-month forward earnings to price and dividend yield.
The personal consumption expenditures ("PCE") price deflator—which comes from the Bureau of Economic Analysis' quarterly report on U.S. gross domestic product—is based on a survey of businesses and is intended to capture the price changes in all final goods, no matter the purchaser. Because of its broader scope and certain differences in the methodology used to calculate the PCE price index, the Federal Reserve ("the Fed") holds the PCE deflator as its preferred, consistent measure of inflation over time.
A market-capitalization-weighted index of the 500 largest U.S. publicly traded companies. The index is widely regarded as the best gauge of large-cap U.S. equities.
The yield (defined below) of a Treasury security (most often refers to U.S. Treasury securities issued by the U.S. government).
Debt securities issued by the U.S. Treasury and backed by the direct "full faith and credit" pledge of the U.S. government. Treasury securities include bills (maturing in one year or less), notes (maturing in two to 10 years) and bonds (maturing in more than 10 years). They are generally considered among the highest quality and most liquid securities in the world.
For bonds and other fixed-income securities, yield is a rate of return on those securities. There are several types of yields and yield calculations. "Yield to maturity" is a common calculation for fixed-income securities, which takes into account total annual interest payments, the purchase price, the redemption value, and the amount of time remaining until maturity.
A line graph showing the yields of fixed income securities from a single sector (such as Treasuries or municipals), but from a range of different maturities (typically three months to 30 years), at a single point in time (often at month-, quarter- or year-end). Maturities are plotted on the x-axis of the graph, and yields are plotted on the y-axis. The resulting line is a key bond market benchmark and a leading economic indicator.
Diversification does not assure a profit nor does it protect against loss of principal.
Historically, small- and/or mid-cap stocks have been more volatile than the stock of larger, more-established companies. Smaller companies may have limited resources, product lines and markets, and their securities may trade less frequently and in more limited volumes than the securities of larger companies.
International investing involves special risks, such as political instability and currency fluctuations. Investing in emerging markets may accentuate these risks.
It is not possible to invest directly in an index.
Investment return and principal value of security investments will fluctuate. The value at the time of redemption may be more or less than the original cost. Past performance is no guarantee of future results.
This material has been prepared for educational purposes only. It is not intended to provide, and should not be relied upon for, investment, accounting, legal or tax advice.
©2026 Standard & Poor's Financial Services LLC. The S&P 500® Index is composed of 500 selected common stocks most of which are listed on the New York Stock Exchange. It is not an investment product available for purchase.