What Do Declining Interest Rates Mean for Stock Returns?

Key Takeaways
Historical data show U.S. stocks have performed differently across various interest rate environments, with no consistent pattern.
Small-cap stocks with low price-to-book ratios and high profits have shown higher average returns, regardless of rate direction.
Market expectations for interest rates, not just actual changes, play a significant role in how stocks have performed historically.
Declining interest rates are generally a good thing for bond returns. All else being equal, as bond yields go down, their prices go up. Many people are familiar with this relationship, but what about stocks? Can declining interest rates inform our expectations for future stock returns?
This question has come into focus for many investors after the Federal Reserve (Fed) elected to cut the federal funds rate by a quarter-point at its September meeting. It was the first rate cut from the Fed since a series of cuts in late 2024, and it lowered the effective Fed funds rate from 4.33% to 4.08%.
More cuts are widely expected going forward. How much and how quickly they happen depends on who you ask. Figure 1 shows two key sources for future rate expectations: the current median projection from the Fed’s Board of Governors and expectations implied by prices in the fed funds futures market.
Figure 1 | Interest Rates Are Expected to Decline, but the Pace Is to Be Determined

Data from 1/1/2020–9/30/2025. Source: FRED. Fed Board median projections for year-end 2025–2027 as of 9/30/2025. Source: Board of Governors of the Federal Reserve System. Market-implied expectation for year-end 2025–2027 as of 9/30/2025. Source: CME Group FedWatch.
Expectations for the end of 2025 are fairly in line between the Fed and the market. Both imply two additional quarter-point cuts by the end of this year. Thereafter, the forecasts diverge. Current market prices suggest two more quarter-point cuts in the first half of 2026, bringing the fed funds rate to 3% (what the Fed currently views as the long-run equilibrium rate) and representing a decline of greater than 1% in less than a year.
In contrast, the Fed projects just one cut in 2026 and another in 2027. This indicates general agreement on the expected direction of rates but a range of views on how quickly they will be lowered.
With this context on rate expectations in mind, let’s return to the original question: What might declining interest rates mean for stock returns?
Let’s start with asset pricing theory, which tells us we should expect lower interest rates to benefit stock returns if, all else being equal, actual rates move lower than what the market expects and has priced into stocks.
Alternatively, stock returns would be expected to be lower if, all else being equal, actual rates decline but in a smaller magnitude than the market expects.
So, from theory, the market’s expectations for the path of rates matter, not just the direction of actual rates. We should consider this when evaluating how stocks have performed in different interest rate environments, which we present in the following sections.
You’ll see results from a few experiments designed to explore what we can learn from historical data on interest rates and stock returns. It’s important to note that the Fed funds rate isn’t the only interest rate that matters. The Fed sets it and specifically establishes an overnight bank lending rate.
Other rates are determined in the open market for debt maturing at different points in the future, from a few weeks out to several decades — all may be relevant to companies. For our analysis, we focus on the 10-year Treasury yield.
Our first experiment aims to understand how U.S. stocks have performed historically in periods when rates decline quickly and how that compares to periods when rates rise quickly or are relatively stable.
We looked at average monthly returns during one-year periods from 1973 through 2024 when the 10-year Treasury yield fell by more than 1%, when it remained between plus-or-minus 1%, and when it rose by more than 1%. Figure 2 Panel A presents the results for broad market U.S. stocks.
Figure 2 | How U.S. Stocks Perform During Different Interest Rate Regimes
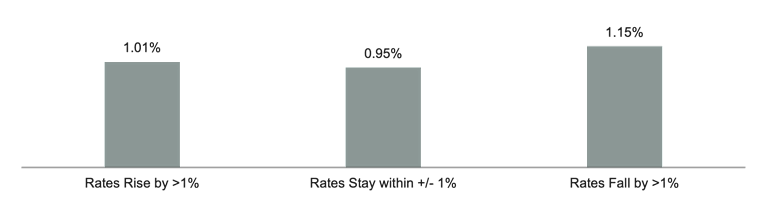
Data from 1973–2024. U.S. stocks and U.S. Small Low Price-to-Book (P/B) stocks are represented by the Market Portfolio and Small Value Portfolio from Ken French’s Data Library. U.S. Small Low P/B High Profits stocks are sourced from Avantis Investors and Sunil Wahal, CRSP Compustat. “High Profits” is defined as companies with a high relative profit-to-book ratio. The total rolling one-year periods in the analysis are 613. Total rolling 1-year periods when rates rise by >1% are 93, periods when rates fall by >1% are 93, and periods when rates stay within +/- 1% are 410.
From this sample analysis, we find that, on average, U.S. stocks have historically performed better during periods when the 10-year Treasury yield declined by more than 1% in a year. This seems consistent with popular beliefs (i.e., lower rates may mean lower interest costs for businesses, and lower rates may suggest lower discount rates on expected future cash flows, meaning higher prices). Still, we should be careful not to get too carried away with these results.
This data alone is far from conclusive. We see differences in returns between the different interest rate environments, but they aren’t all consistent with conventional wisdom. For example, the market has outperformed modestly when rates rose versus when rates were stable. But, on the upside, historical stock returns have been meaningfully positive regardless of the rate environment.
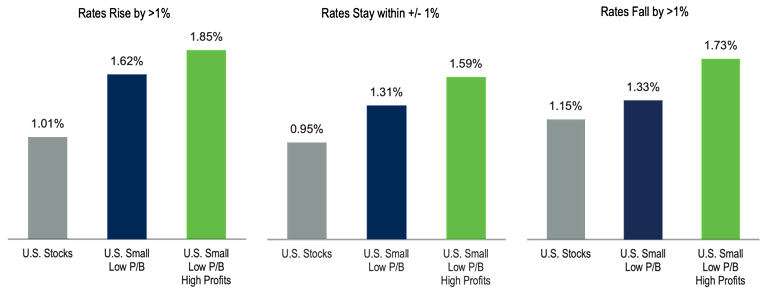
In Figure 2 Panel B, we add perspective on small-cap stocks. Some believe that small-caps are expected to do better than the market as a whole when rates are declining and suffer disproportionately when rates are rising.
To investigate, we add to the analysis two segments of the U.S. small-cap market: small companies with low prices to their book equity (P/B) and small companies with both low P/B and higher levels of profitability. The data highlights two key points.
First, we see that small-cap companies with low relative prices have, on average, outperformed the overall market in periods when rates were falling quickly. Still, we see no evidence supporting the view that small-cap companies with low relative prices perform worse when rates rise quickly. In fact, both small low relative price portfolios produced higher average returns than the market in each interest rate environment.
Second, the difference in returns between the two small-cap portfolios is also meaningful. So, small-cap stocks with attractive price multiples may help investors in any rate environment. Still, we can expect to do better by considering a more complete picture of company fundamentals (i.e., including cash flows and not just considering prices and book equity).
Now, let’s look at the data through a different lens. In our second experiment, we consider interest rate cycles over time, which in some cases have historically spanned periods shorter than a year as well as periods of many years. Figure 3 shows the 10-year Treasury yield over our sample period, with vertical lines indicating rate peaks and troughs.
Figure 3 | Historical 10-Year Treasury Rate Cycles
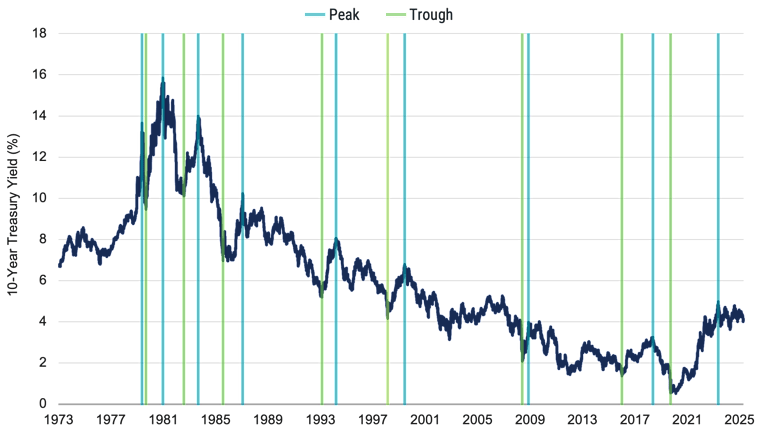
Data from 1/1/1973 – 12/31/2024. Source: FRED, Avantis Investors.
We compute returns for the same portfolios from our first experiment, but this time during the interest rate cycles, which correspond to the peaks and troughs from Figure 3. Results in Figure 4 Panel A cover the full peak-to-trough (falling rates) and trough-to-peak (rising rates) periods. Panel B splits each into halves to assess whether we see different outcomes early or later within rate cycles.
Figure 4 | U.S. Stock Returns During Interest Rate Cycles
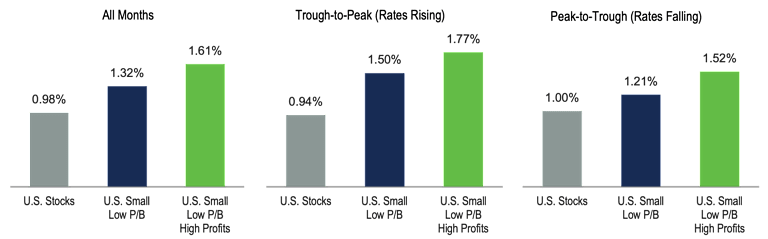
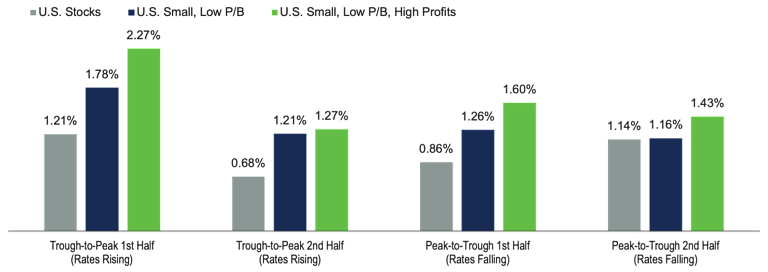
“High profits” is defined as companies with a high relative profit-to-book ratio. The total number of months in the analysis is 624. Months in trough-to-peak (rates rising) are 243, and months in peak-to-trough (rates falling) are 381. Months in trough-to-peak first half (rates rising) are 121, months in trough-to-peak second half (rates rising) are 122, months in peak-to-trough first half (rates falling) are 197, and months in peak-to-trough second half (rates falling) are 184.
This analysis gives us many more data points to evaluate how stocks have historically performed in relation to what’s happening with interest rates. Still, we come away with takeaways quite similar to those from our first experiment.
We see slightly higher average monthly returns for the U.S. market during declining rate cycles compared to returns in other periods, but the differences aren’t significant, and the data is inconclusive.
Again, regardless of the rate environment (even if we look into the first or second half of each rate cycle), we find higher-than-market average returns from small-cap stocks with low price-to-book ratios and even greater outperformance from small-cap stocks with both low price-to-book ratios and high profits.
What Really Matters for Investors Amid Changing Rate Environments
While we believe this analysis offers some potentially useful context for investors in a period where there are expectations for changing interest rates in the near term, we would suggest caution in using any of these data points as the basis for how one might effectively time the market.
It’s critical to understand that, with all the results shown, there was benefit from hindsight. We can observe past periods of quick-moving rates and rate cycles. Standing here today, it’s unknown exactly when and by how much rates will change in the future.
And let’s not forget that it’s not just the direction of rates that matters for future stock returns, but also how reality compares to the market’s expectations already priced into stocks.
In our view, what really stands out from the analysis is that, on average, the market has done pretty well for investors, whether rates have gone up or down in the past. You didn’t have to know when rates were rising or falling!
Additionally, considering company prices and fundamentals within your stock exposure (critically, not ignoring essential information like cash flows) has also made a big difference regardless of the direction of rates.
Explore More Insights
Glossary
The federal funds rate is an overnight interest rate banks charge each other for loans. More specifically, it's the interest rate charged by banks with excess reserves at a Federal Reserve district bank to banks needing overnight loans to meet reserve requirements. It's an interest rate that's mentioned frequently within the context of the Federal Reserve's interest rate policies. The Federal Reserve's Open Market Committee (defined below) sets a target for the federal funds rate (which is a key benchmark for all short-term interest rates, especially in the money markets), which it then supports/strives for with its open market operations (buying or selling government securities).
The Fed is the U.S. central bank, responsible for monetary policies affecting the U.S. financial system and the economy.
Investment "fundamentals," in the context of investment analysis, are typically those factors used in determining value that are more economic (growth, interest rates, inflation, employment) and/or financial (income, expenses, assets, credit quality) in nature, as opposed to "technicals," which are based more on market price (into which fundamental factors are considered to have been "priced in"), trend, and volume factors (such as supply and demand), and momentum. Technical factors can often override fundamentals in near-term investor and market behavior, but, in theory, investments with strong fundamental supports should maintain their value and perform relatively well over long time periods.
Measures a company’s current market price relative to its book value. It is calculated by dividing the stock price per share by book value per share. Book value is generally a firm’s reported assets minus its liabilities on its balance sheet.
The yield (defined below) of a Treasury security (most often refers to U.S. Treasury securities issued by the U.S. government).
Debt securities issued by the U.S. Treasury and backed by the direct "full faith and credit" pledge of the U.S. government. Treasury securities include bills (maturing in one year or less), notes (maturing in two to 10 years) and bonds (maturing in more than 10 years). They are generally considered among the highest quality and most liquid securities in the world.
For bonds and other fixed-income securities, yield is a rate of return on those securities. There are several types of yields and yield calculations. "Yield to maturity" is a common calculation for fixed-income securities, which takes into account total annual interest payments, the purchase price, the redemption value, and the amount of time remaining until maturity.
Historically, small- and/or mid-cap stocks have been more volatile than the stock of larger, more-established companies. Smaller companies may have limited resources, product lines and markets, and their securities may trade less frequently and in more limited volumes than the securities of larger companies.
Investment return and principal value of security investments will fluctuate. The value at the time of redemption may be more or less than the original cost. Past performance is no guarantee of future results.
This material has been prepared for educational purposes only. It is not intended to provide, and should not be relied upon for, investment, accounting, legal or tax advice.
The opinions expressed are those of the investment portfolio team and are no guarantee of the future performance of any Avantis Investors portfolio.
Generally, as interest rates rise, the value of the bonds held in the fund will decline. The opposite is true when interest rates decline.