What’s Up with Gold?

Key Takeaways
Gold prices have risen sharply in recent years, driven by demand and limited supply.
The launch of gold ETFs along with central bank purchases have been influential factors to the overall surge in gold demand.
Gold has shown near-zero correlation to stocks but higher volatility than bonds.
What do gold, cryptocurrencies like Bitcoin (BTC), paintings, furs and diamonds all have in common? Things you’ve seen on a “Real Housewives” episode, you say? Maybe so, but here’s what we had in mind.
Each is an asset that produces no cash flow. They’re like buying a goose that lays no eggs.
Unlike stocks and bonds, whose prices are directly linked to the earnings or income they are expected to generate in the future, the prices of assets with no cash flow are determined by the forces of supply and demand. If demand for the asset exceeds its available supply, the price will go up. Ultimately, prices reflect what the market will bear — what buyers are willing to pay and what sellers are willing to take.
If you remember the Tickle Me Elmo and Beanie Babies craze in the ’90s, then you’ve seen these mechanics of supply and demand at play. After selling out at retailers, these plushy, stuffed animal figures sold secondhand for thousands of U.S. dollars (USD). Limited supply and high demand sent prices soaring just for the right to hold one. Today, you can pick up a brand-new Tickle Me Elmo for less than $50.
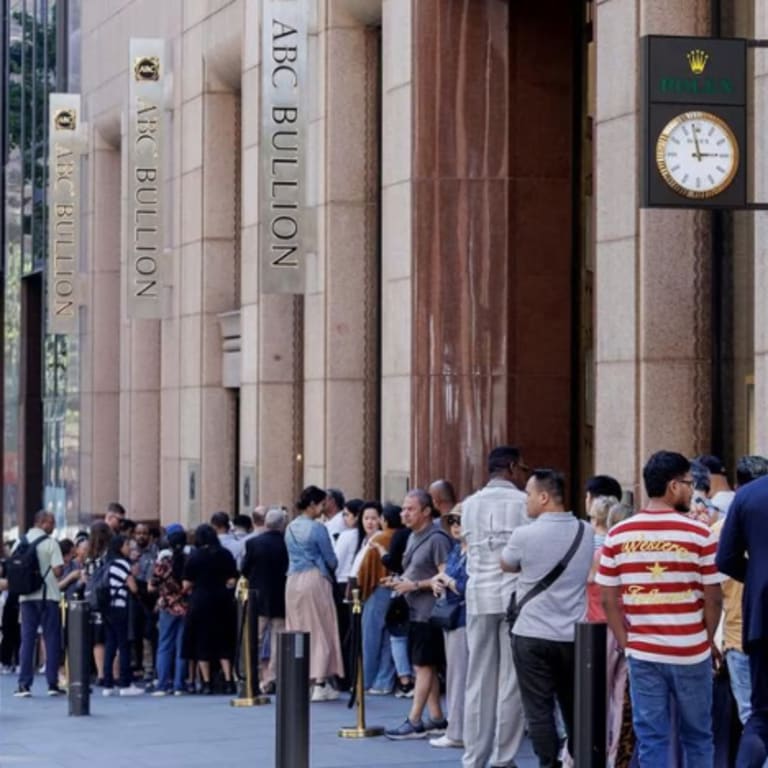
Gold buyers in Sydney, Australia, wait in line to make their purchases on Oct. 31, 2025. Photo credit: Paul Saliba, founder and managing director, Evolutionary Portfolio Services Pty Ltd.
However, stuffed animals and gold aren’t the same in the eyes of most investors. Gold is often perceived as a diversifier, an expected hedge against inflation, or a safe haven for the fearful to park their cash. This article examines why so many seem to be interested in the “yellow stuff” these days and what investors need to know for their portfolios.
Gold Price Spike: What’s Driving Market Interest?
If you look at the recent returns from gold, it’s easy to see why it’s caught investors’ attention. Figure 1 shows the spot price of an ounce of gold in USD since 1975, after gold futures contracts began trading. There’s a noticeable spike in the price over the last few years.
At the start of October 2022, 1 ounce of gold was worth about $1,655. By the end of October 2025, that same ounce of gold was valued at about $4,023, representing a 143% cumulative gain in just three years.
Figure 1 | The Price of Gold Has Risen More Than 140% in the Last 3 Years

Data from 2/1/1975 - 10/31/2025. Source: Investing.com. Past performance is no guarantee of future results.
What’s Fueling Gold’s Price Increase?
As previously mentioned, the price of gold increases when demand exceeds supply. But what can we say about the factors driving demand, and what do we know about supply?
Let’s start with supply, which is inelastic for gold. When supply is elastic, it will rise with prices to meet heightened demand. However, the supply of gold doesn’t function in this way because gold is a finite resource that is time-consuming to mine. Each year, the increase in the gold supply remains relatively small, regardless of the fluctuations in its price.
For example, in 2024, global gold production represented an increase of less than 2% in total supply. As a result, the price of gold tends to be highly sensitive to changes in demand.
On the demand side, researchers have identified a few effects that may have contributed to higher demand and prices for gold in past years.1 In 2004, the world’s first exchange-traded fund (ETF) backed by physical gold was launched. Before then, buying gold typically meant purchasing and storing it yourself. This wasn’t desirable for many investors and likely left some demand unmet. Gold ETFs appear to have provided a convenient outlet for this pent-up demand for gold.
In Figure 2, we revisit the gold price data from Figure 1 to highlight the point in time when gold ETFs first became available. The subsequent price increases don’t confirm causality, but it’s plausible that demand taken up by gold ETFs has played a role.
Figure 2 | Gold Prices Have Risen Since the Introduction of Gold ETFs in 2004
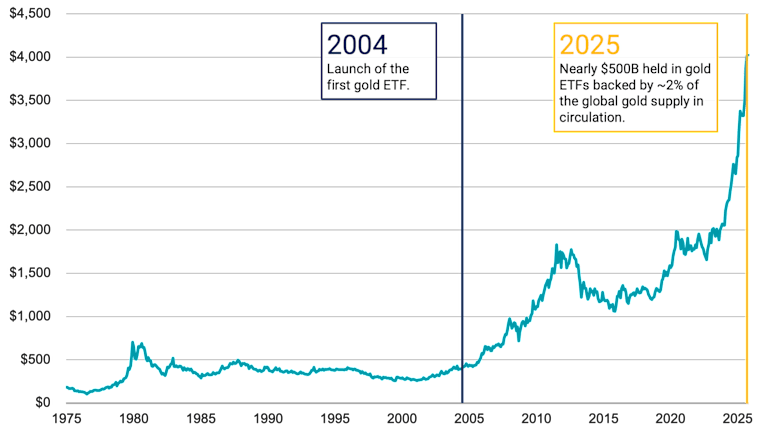
Data from 2/1/1975 - 10/31/2025. Source: Investing.com, World Gold Council. Past performance is no guarantee of future results.
Another potential contributor to gold demand has come from central banks. According to the International Monetary Fund, central banks have added more than 2,000 metric tons of gold to reserve assets since 2017. This represents more than 1% of the world’s in-circulation gold supply. Coupled with rising prices, the share of gold in global central bank reserves has increased significantly over this period, as shown in Figure 3.
Figure 3 | Gold Has Become a Greater Share of Central Bank Reserves

Data as of 12/31/2017 and 3/31/2025. Source: International Monetary Fund.
While some have suggested that non-U.S. economies have been “de-dollarizing,” buying gold to diversify reserves heavily held in USD, recent Federal Reserve (Fed) research sheds some doubt on this theory.2
The Fed study found that 62 countries increased their gold reserves between 2008 and 2023, but only a few of them clearly reduced USD reserves while increasing gold reserves — specifically China, Russia and Turkey. For about half of the remaining countries, increases in gold weren’t found to come at the expense of USD reserves. For the other half, there wasn’t enough public data to draw a conclusion. The USD remains the global reserve currency, accounting for approximately 60% of all reserves, and it is also still China’s largest reserve currency.
What about investors who are chasing hot returns driven by the fear of missing out (FOMO), or fearful investors buying gold as a perceived safe haven? Both could also play some role in the recent demand. Regardless of the source, it all adds up.
What Might We Expect from Gold Returns in the Future?
Well, no one knows for sure, but the work of researchers Erb and Harvey again provides useful context, both from historical and theoretical perspectives. They conclude that over the last 2,500 years, gold has roughly maintained its value after accounting for inflation.
For example, they find that the wages paid in gold to ancient Roman military officers are about the same as the amount of gold U.S. Army captains could purchase with their full annual salaries today. This suggests that, over the very long term, gold has generated a zero real return.
In the short term, however, gold is volatile and at times yields positive real returns, while at other times negative real returns. This is consistent with what you would expect from an asset whose prices fluctuate solely in response to changes in supply and demand.
Their findings imply another important takeaway. If the expected real return of gold is zero, it is reasonable to expect that returns for gold going forward will be lower after a period during which gold prices rise much faster than inflation. This is similar to stocks trading at elevated valuations. The higher prices suggest lower expected returns than when prices were lower.
But just like stocks whose prices and valuations can stay high for long periods, the same can happen with gold. If strong demand for gold persists, we may continue to see the price go up, even if it's already high. However, when demand drops because investors believe the price is no longer worth it or for other reasons, we can expect the price to fall.
Should Gold Have a Role in Diversified Investor Portfolios?
Some say yes, and some say no. Warren Buffett has long been in the “no” camp, describing gold as an “unproductive” asset because it doesn’t create anything of value or generate income. He compares buying gold and hoping someone will pay more for it later to gambling rather than investing.
However, that’s just one person’s opinion, so let’s look at the data for a more objective context. In Figure 4, we present an analysis based on annual returns from 1928 to 2024 for gold and other common asset classes in investor portfolios, including stocks and bonds.
Figure 4 | Historical Returns, Volatility and Correlations
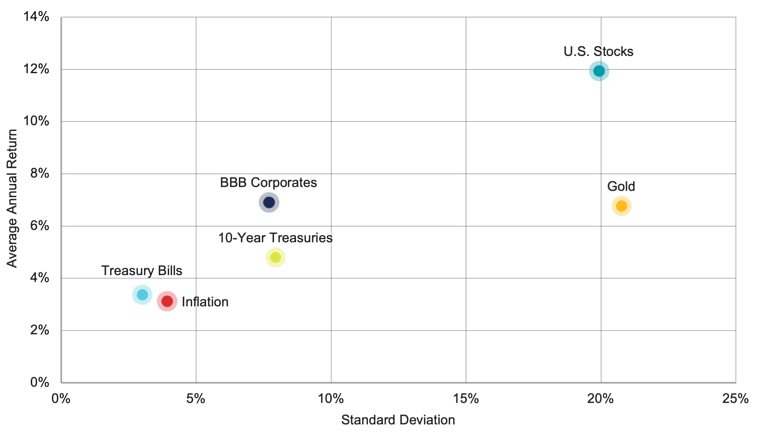
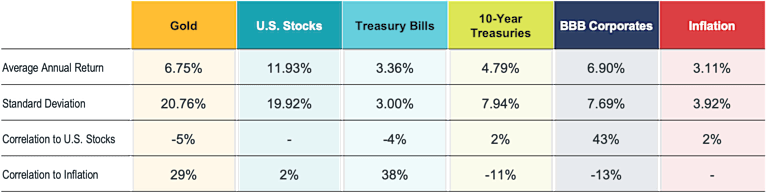
Data is based on nominal annual returns from 1928-2024. Sources: Ken French Data Library and NYU Stern School of Business. Past performance is no guarantee of future results.
There are several key takeaways. Gold hasn’t had a zero real return in at least the last 96 years. However, its 6.75% nominal average annual return amounts to less than 4% after accounting for inflation. That’s less than half the real return of U.S. stocks but with higher yearly volatility (standard deviation). BBB-rated corporate bonds, compared to gold, have provided a slightly higher average return with less than half the volatility.
Gold has exhibited near-zero correlation to U.S. stocks but so have Treasuries over the long term. When paired with equities, both have historically tended to help buffer overall portfolio results when equity markets perform poorly, but bonds have achieved this with significantly lower volatility.
Nothing is guaranteed, of course. Most bond asset classes didn’t provide a positive return when equities declined in 2022, but gold also doesn’t have a perfect track record of rising when stocks fall.
As an inflation hedge, the effectiveness of gold is also questionable. There is some positive correlation, but gold’s much higher volatility compared to inflation makes it an imperfect hedge at best.
Evaluating Gold’s Fit for Your Goals
There may be reasonable uses for gold in investor portfolios; however, there might be potentially better options to help achieve an investor’s goals. Importantly, that’s what matters for any investor considering gold as a holding: What’s the goal? Only after this is clear can you determine if it makes sense for you.
That assessment is crucial. As anyone who hoarded Beanie Babies and saw their prices plummet may attest, simply buying any asset because others have recently had success with it is never advisable. In our view, that’s just gambling, not investing.
Explore More Insights
Claude B. Erb and Campbell R. Harvey, “Understanding Gold,” October 7, 2025. Available at SSRN.
Colin Weiss, “De-Dollarization? Diversification? Exploring Central Bank Gold Purchases and the Dollar’s Role in International Reserves,” International Finance Discussion Papers, Board of Governors of the Federal Reserve, September 2025.
Glossary
Bonds issued by companies that have a BBB credit rating — which is the lowest tier of investment-grade ratings.
Entity responsible for oversight of a nation’s monetary system, including policies and interest rates.
Correlation measures the relationship between two investments--the higher the correlation, the more likely they are to move in the same direction for a given set of economic or market events. So if two securities are highly correlated, they will move in the same direction the vast majority of the time. Negatively correlated investments do the opposite--as one security rises, the other falls, and vice versa. No correlation means there is no relationship between the movement of two securities--the performance of one security has no bearing on the performance of the other. Correlation is an important concept for portfolio diversification--combining assets with low or negative correlations can improve risk-adjusted performance over time by providing a diversity of payouts under the same financial conditions.
Measurements of credit quality (defined below) provided by credit rating agencies (defined below). Those provided by Standard & Poor's typically are the most widely quoted and distributed, and range from AAA (highest quality; perceived as least likely to default) down to D (in default). Securities and issuers rated AAA to BBB are considered/perceived to be "investment-grade"; those below BBB are considered/perceived to be non-investment-grade or more speculative.
Similar to a mutual fund, an exchange-traded fund (ETF) represents a group of securities, but the ETF trades on an exchange like an individual stock. An ETF generally follows the performance of an index, such as the S&P 500 Index.
The Fed is the U.S. central bank, responsible for monetary policies affecting the U.S. financial system and the economy.
A futures contract is an agreement to buy or sell a specific amount of a commodity or financial instrument at a particular price on a stipulated future date. Futures contracts are typically used as a hedging/risk management tool in portfolio management.
Inflation, sometimes referred to as headline inflation, reflects rising prices for consumer goods and services, or equivalently, a declining value of money. Core inflation excludes food and energy prices, which tend to be volatile. It is the opposite of deflation (see Deflation).
The percentage gain or loss on an investment without adjusting for inflation.
The nominal return minus inflation, showing how much your money grew in terms of purchasing power.
Standard deviation is a statistical measurement of variations from the average. In financial literature, it's often used to measure risk, when risk is measured or defined in terms of volatility. In general, more risk means more volatility, and more volatility means a higher standard deviation—there's more variation from the average of the data being measured. In this context, reducing risk means seeking lower standard deviation.
Debt securities issued by the U.S. Treasury and backed by the direct "full faith and credit" pledge of the U.S. government. Treasury securities include bills (maturing in one year or less), notes (maturing in two to 10 years) and bonds (maturing in more than 10 years). They are generally considered among the highest quality and most liquid securities in the world.
For bonds and other fixed-income securities, yield is a rate of return on those securities. There are several types of yields and yield calculations. "Yield to maturity" is a common calculation for fixed-income securities, which takes into account total annual interest payments, the purchase price, the redemption value, and the amount of time remaining until maturity.
Investment return and principal value of security investments will fluctuate. The value at the time of redemption may be more or less than the original cost. Past performance is no guarantee of future results.
This material has been prepared for educational purposes only. It is not intended to provide, and should not be relied upon for, investment, accounting, legal or tax advice.
The opinions expressed are those of the portfolio team and are no guarantee of the future performance of any Avantis fund.
References to specific securities are for illustrative purposes only and are not intended as recommendations to purchase or sell securities. Opinions and estimates offered constitute our judgment and, along with other portfolio data, are subject to change without notice.
Generally, as interest rates rise, the value of the bonds held in the fund will decline. The opposite is true when interest rates decline.
Diversification does not assure a profit nor does it protect against loss of principal.