Deglobalization, Currency Movements & the Case for Global Diversification

Key Takeaways
U.S. investors are currently significantly overweight in U.S. stocks, which can limit diversification benefits.
Non-U.S. stocks have outperformed U.S. stocks so far in 2025, driven by a weakening dollar and shifting global market dynamics.
Higher tariffs and trade barriers may lead to decreased trade and deglobalizing effects.
A recent study from Morningstar’s Jeff Ptak estimates that the average U.S. fund investor held about 82% of their equity portfolios in U.S. stocks as of late 2024.1 Although the U.S. market has undoubtedly grown relative to non-U.S. stocks over the last 15 to 20 years (as shown in Figure 1), 82% is still far more than the weight of U.S. stocks in the global market, which stood at about 66% at the end of last year (and down a bit this year).
Figure 1 | U.S. Outperformance Over the Last 15+ Years Has Led to a Larger Share of the Global Market
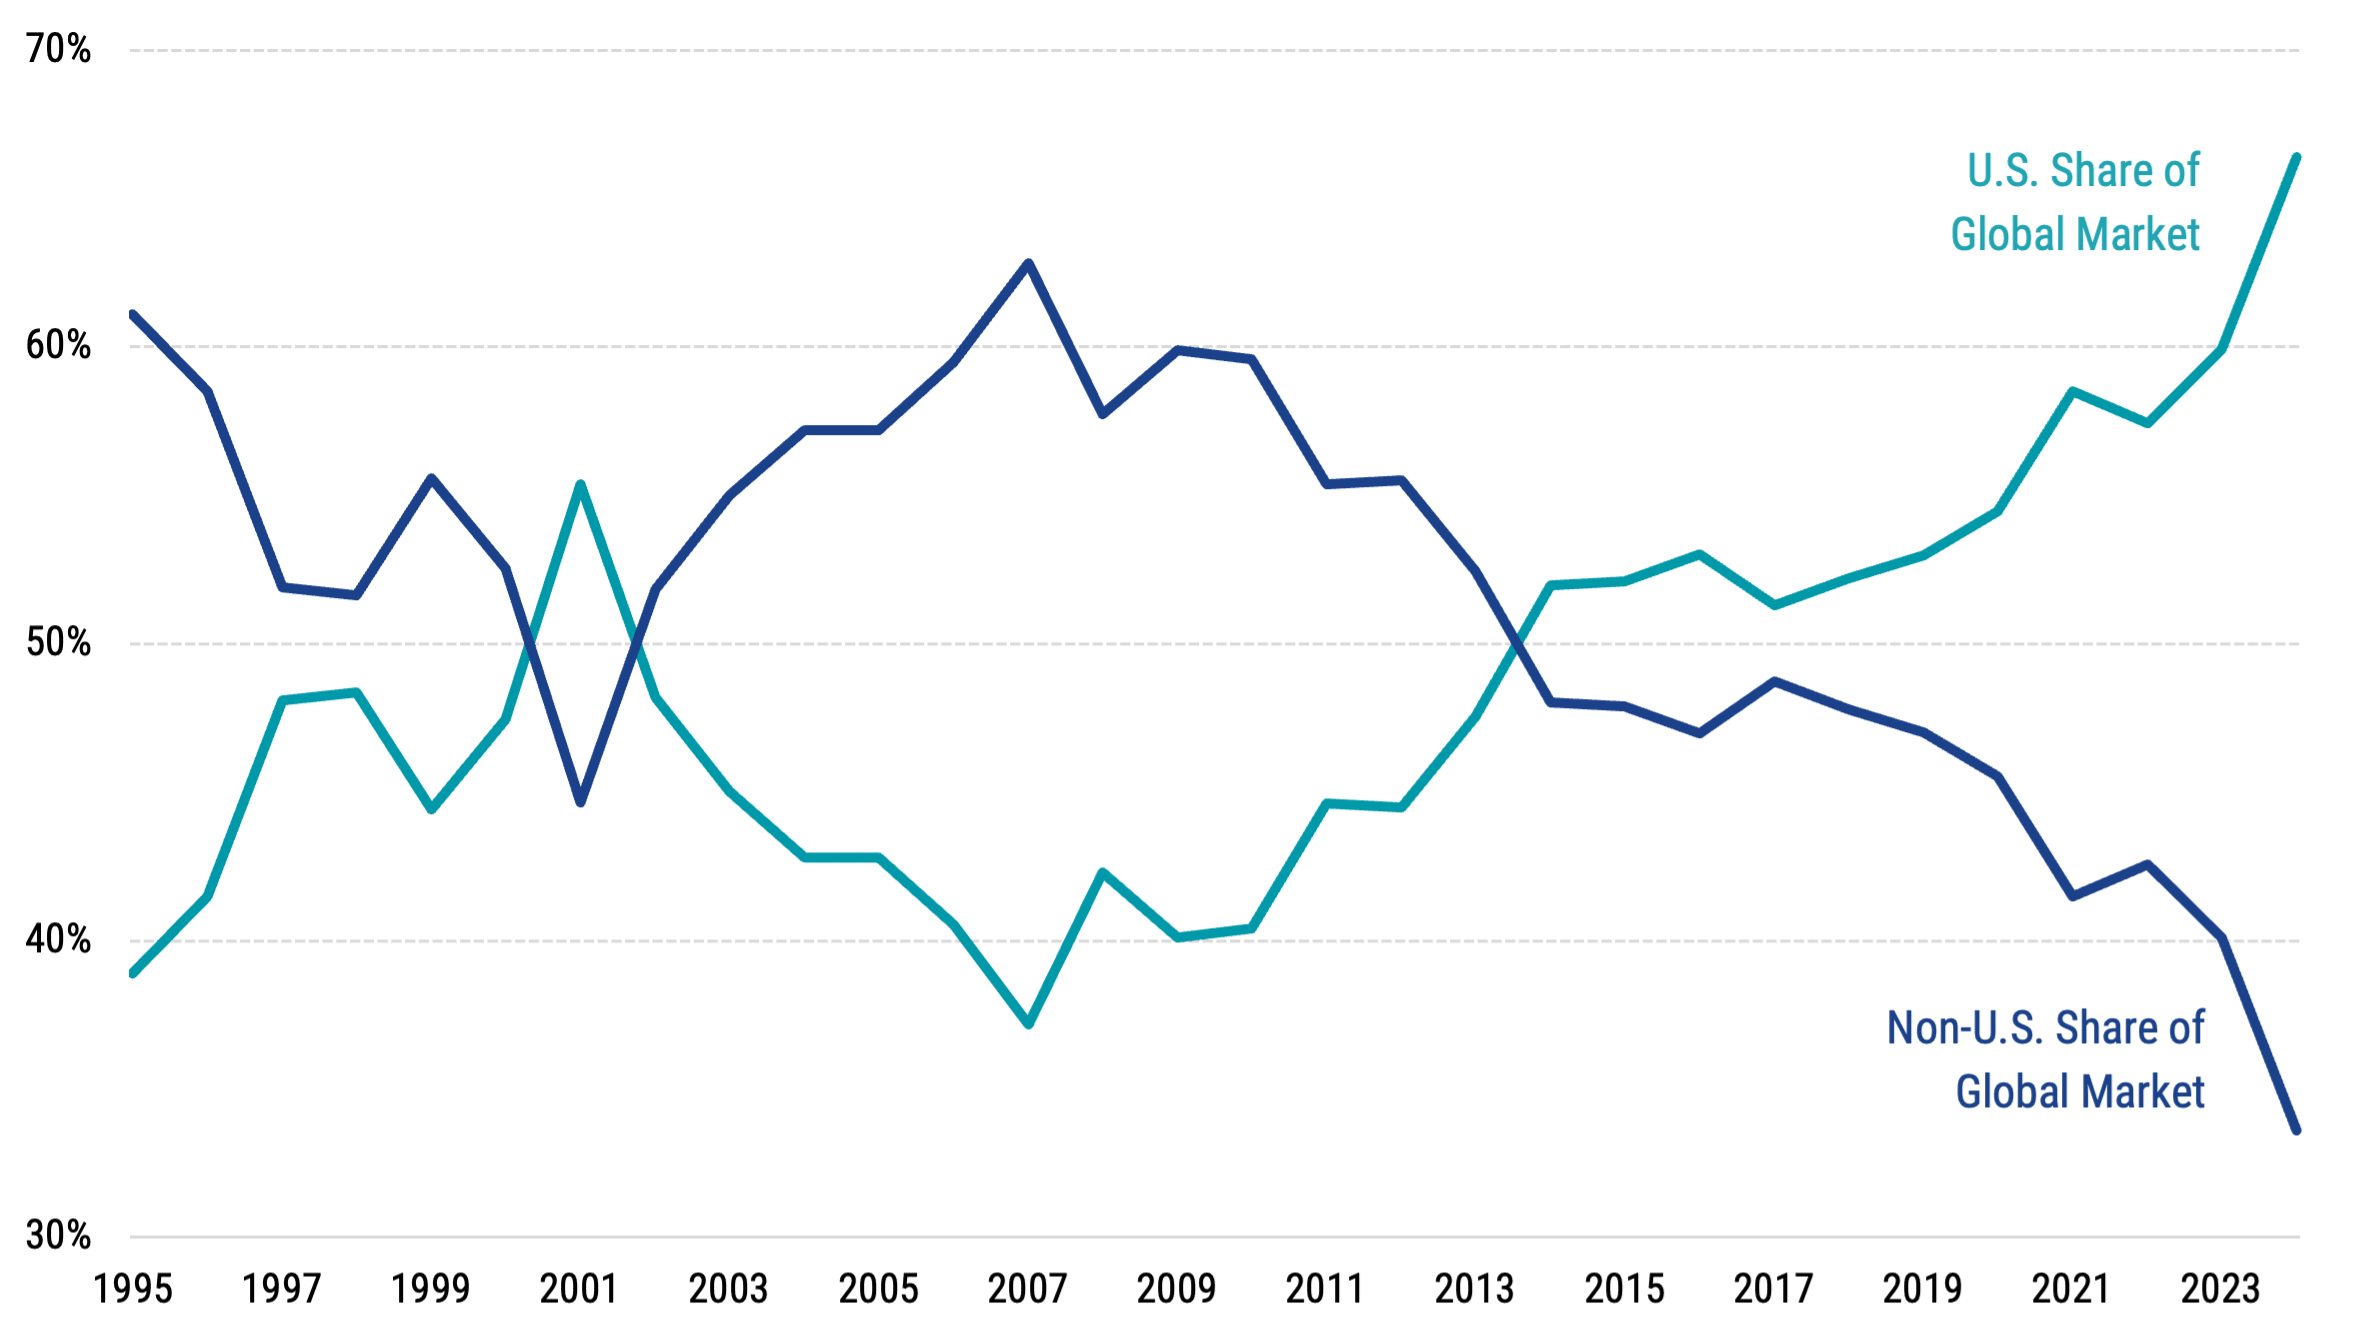
Data from 12/29/1995-12/31/2024. Source: Bloomberg. U.S. share of global market represented by the MSCI USA Index. Non-U.S. share of global market represented by MSCI ACWI Index. Past performance is no guarantee of future results.
The point is not that the market weight should be the right choice for every investor. There are many reasons why an investor may be better served by having a lower allocation to non-U.S. stocks, such as taxation and costs. Other investors might prefer to more heavily invest in U.S. stocks due to unfamiliarity with foreign investments or the belief that past U.S. market performance will continue.
Ultimately, we believe the reasons behind this decision matter and should be intentionally designed for one’s long-term goals. Heavily overweighting a single country can limit potential benefits of diversification.
So, in a time of high uncertainty in global markets, we offer reminders and context from the current market and economic environment that we believe support the case for global diversification and adopting a long-term perspective.
After a Long Run of U.S. Outperformance, the Script Has Flipped So Far in 2025
The basic idea behind diversifying across global markets is that our home market will outperform sometimes and underperform other times. Investing across the global opportunity set means that if domestic stocks perform poorly, then outperformance from other markets will improve the overall returns of our portfolio. This diversification can lead to better returns than if we had invested only in local stocks.
It’s a simple yet sound principle of investing, given the variability of single-country returns over time. However, for some, these concepts may be difficult to trust when, for years, the U.S. market has seemed to deliver stronger returns than many other markets.
This year has been different. Four months is an admittedly brief period, but it’s also a good reminder of how quickly things can change and why investors should be careful not to infer that past performance can predict what will happen next.
As the marketplace gathers new information, prices can shift quickly as investors weigh changing prospects and risks across different markets.
We’ve seen that play out recently, and the magnitude of non-U.S. outperformance hasn’t been small. Figure 2 compares the year-to-date cumulative returns of the S&P 500® Index (U.S. stocks) and the MSCI ACWI ex-USA Index (non-U.S. stocks). While the U.S. market is down on the year (-4.9%), non-U.S. stocks are up (8.0%) with relative outperformance near 13%!
Figure 2 | International Market Exposure Has Helped in 2025
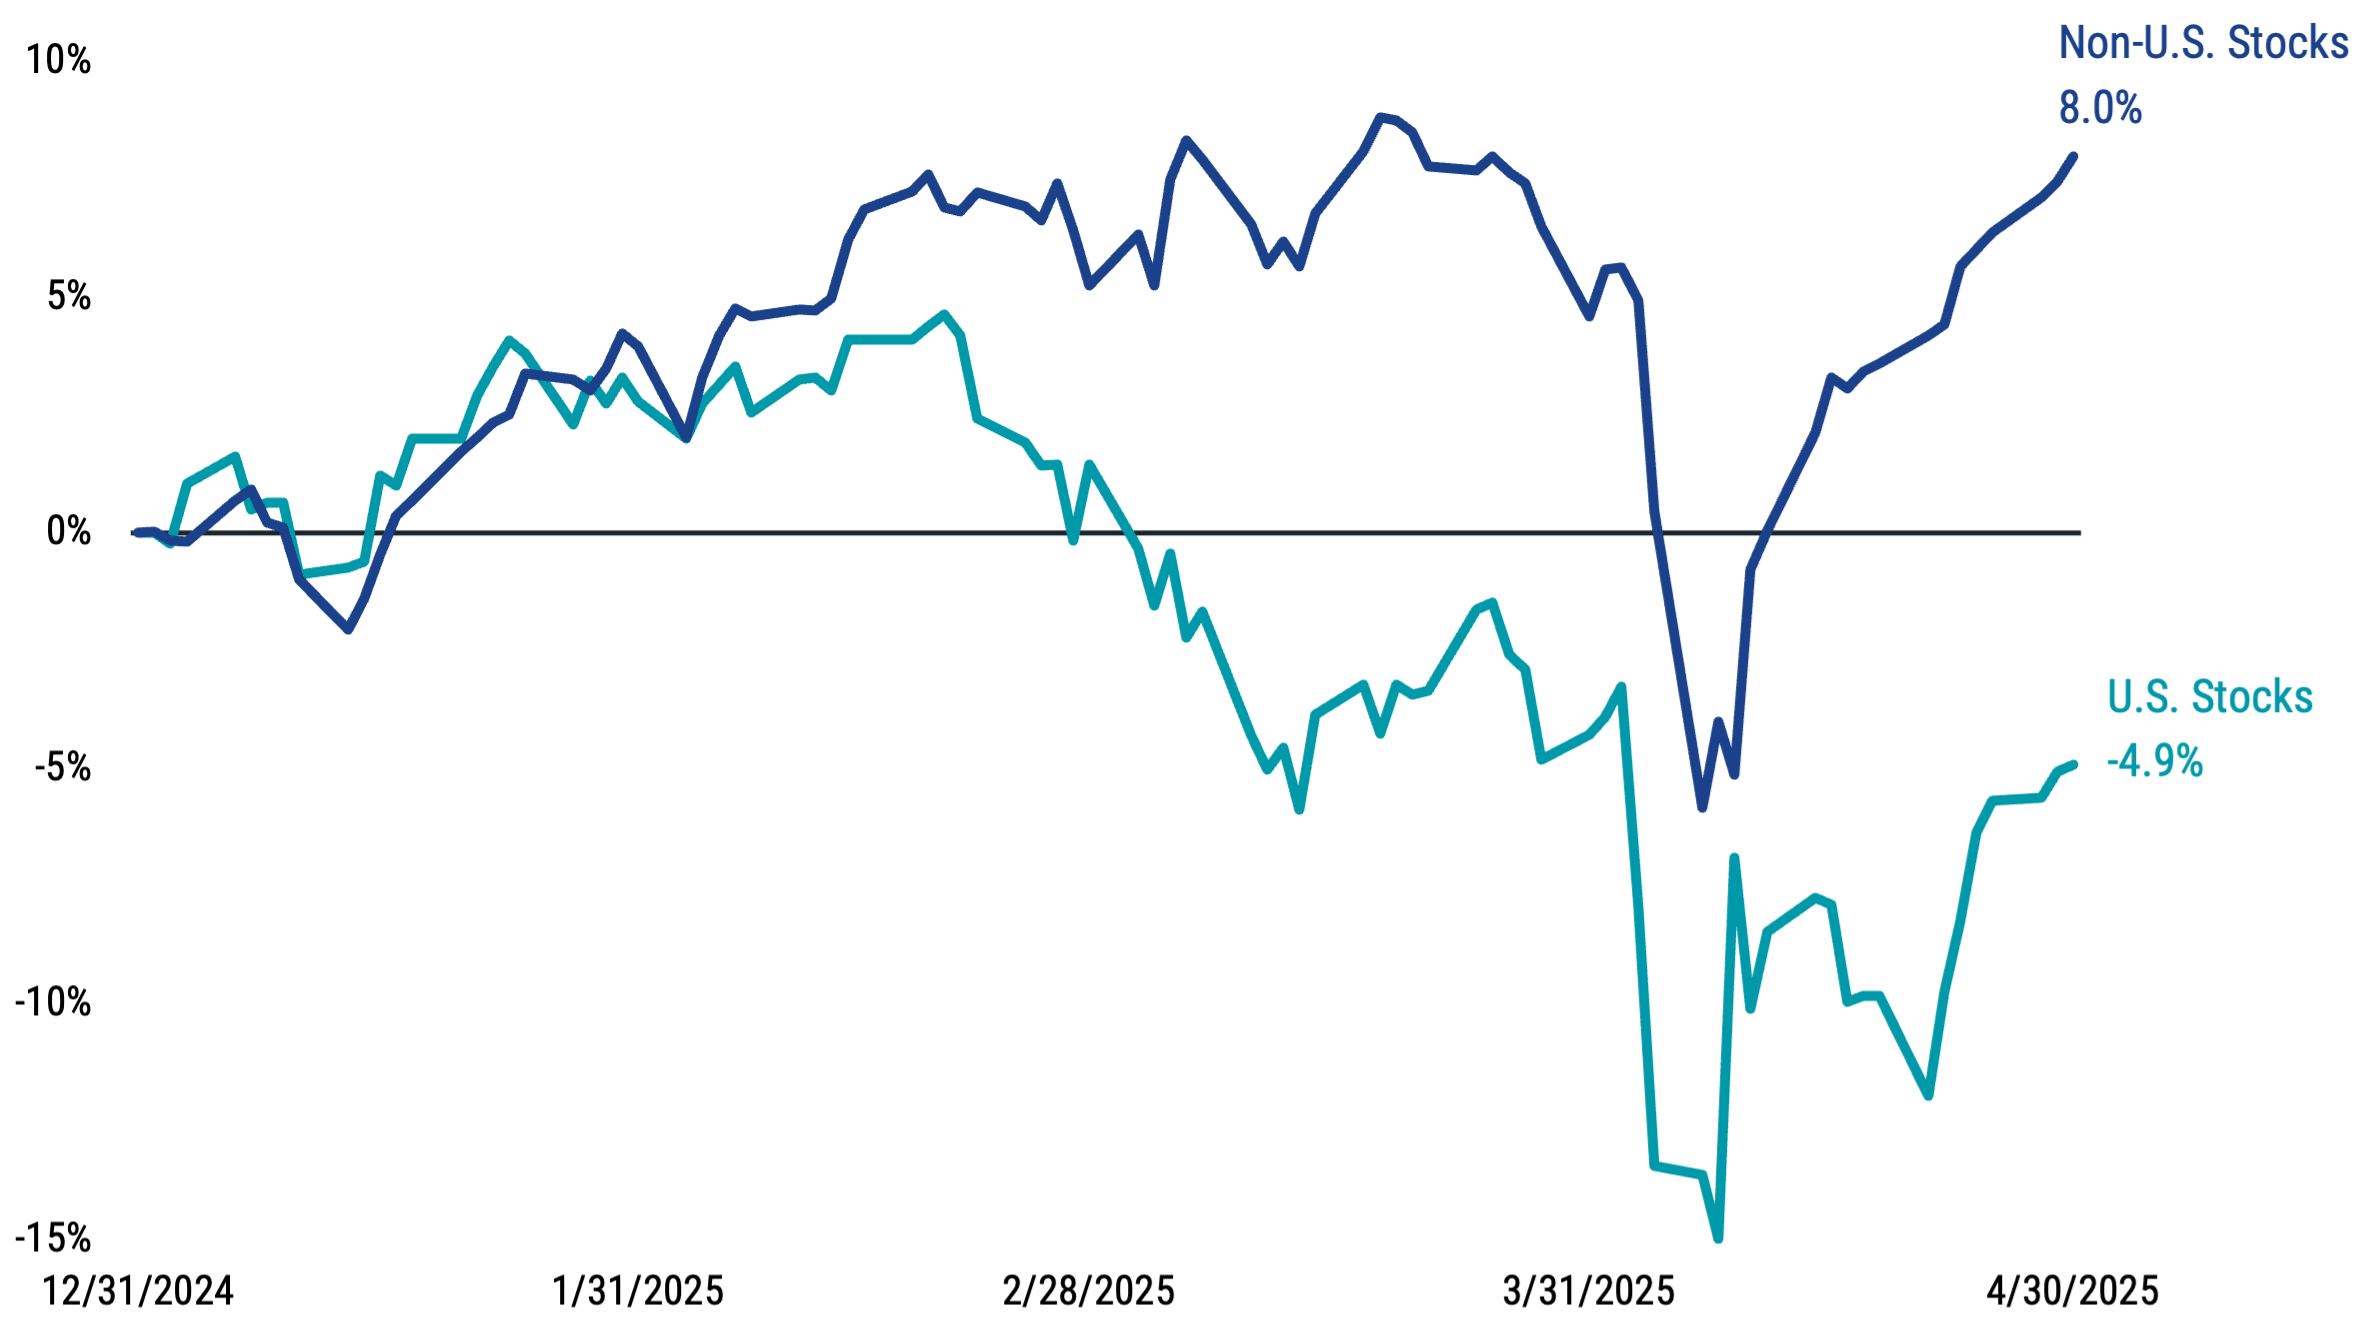
Data from 12/31/2024-4/30/2025. Source: MSCI, S&P. Past performance is no guarantee of future results.
Currency Effects Can Play a Role
A weakening dollar has been part of the story for non-U.S. stock returns in 2025. When U.S. investors buy foreign stocks, they become exposed to two sources of return. First, they receive the return of the underlying stocks in their local currencies. Second, the total return of the investment reflects changes in the exchange rates between the U.S. dollar (USD) and the local currencies held.
Simply put, a weakening dollar will contribute to USD-based returns (i.e., you can get more dollars for a unit of foreign currency than before). In contrast, a strengthening dollar detracts (i.e., you can get fewer dollars than before).
In 2025, we’ve observed the former, and it has contributed to non-U.S. stock returns in USD. Figure 3 shows the cumulative year-to-date return for a commonly referenced gauge for the dollar (ICE U.S. Dollar Index), which measures the change in USD versus a basket of major international currencies. This year, the index has declined by more than 8%.
Figure 3 | The Weakening Dollar in 2025 Has Helped Non-U.S. Stocks Held in USD
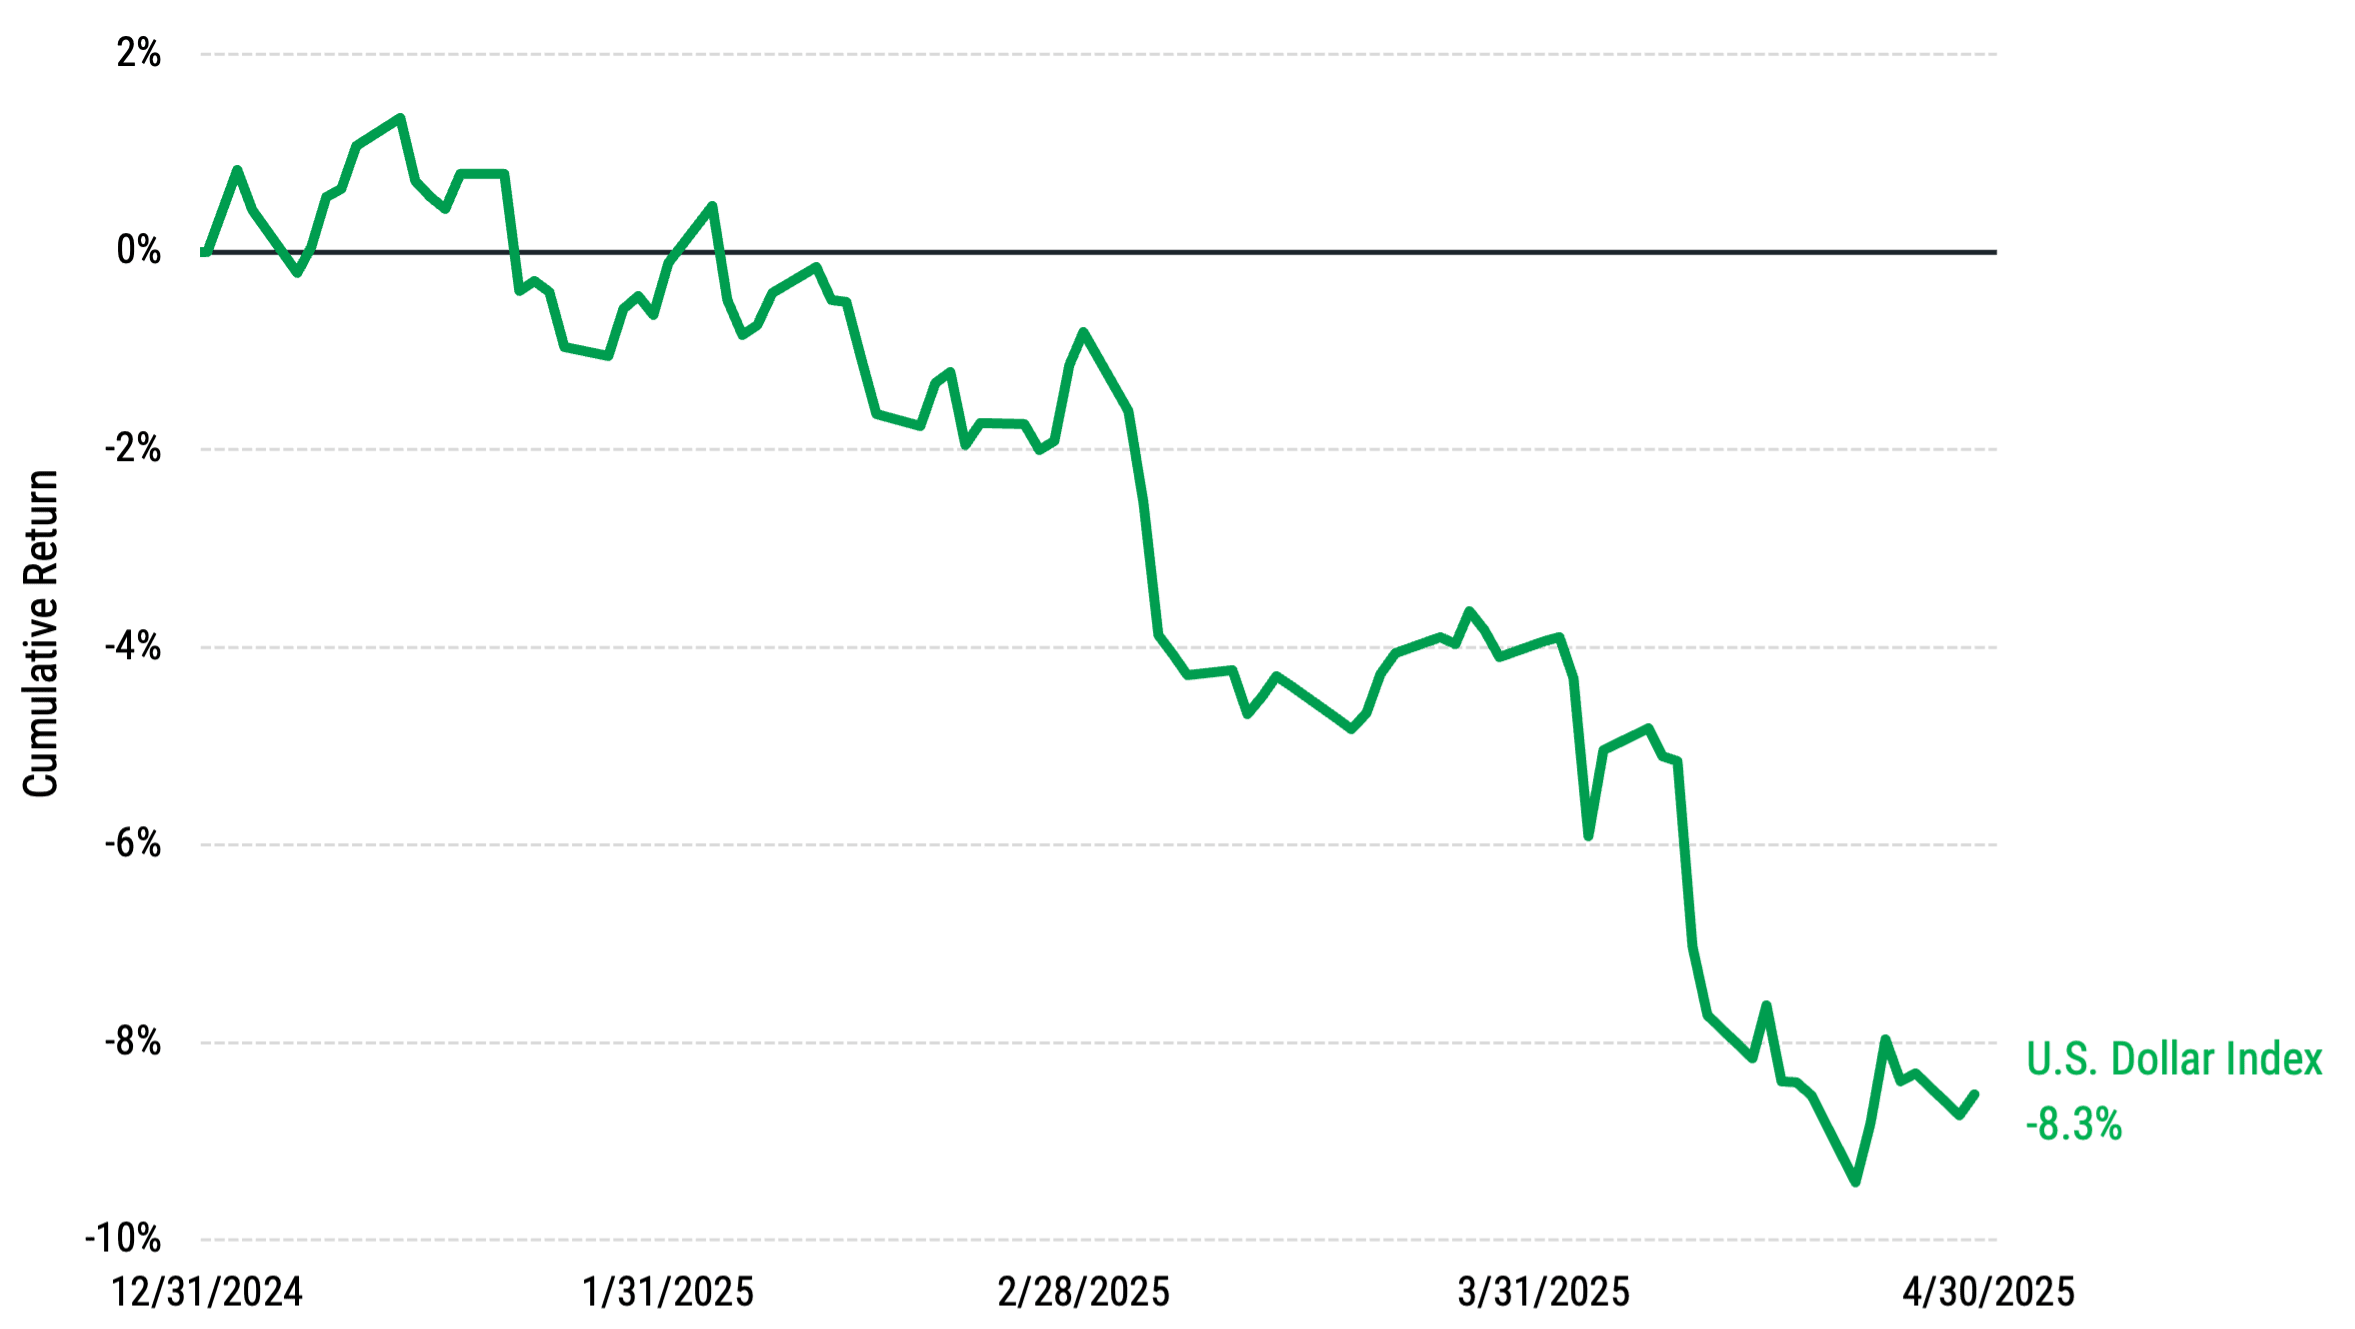
Data from 12/31/2024-4/30/2025. U.S. Dollar Index (DXY) from ICE. Source: Bloomberg. The U.S. Dollar Index (DXY) is a measure of the value of the United States dollar relative to a basket of foreign currencies. The U.S. Dollar Index goes up when the U.S. dollar gains strength (value) compared to these other currencies. Past performance is no guarantee of future results.
Importantly, we know this isn’t the first time we’ve seen non-U.S. markets beat the U.S. Historically, periods of non-U.S. outperformance have often coincided with a weakening dollar. We see this in Figure 4, which plots rolling five-year periods of U.S. stock returns minus non-U.S. stock returns versus monthly prices for the U.S. Dollar Index.
Figure 4 | Past Periods of Non-U.S. Outperformance Have Tended to Coincide with a Weakening Dollar
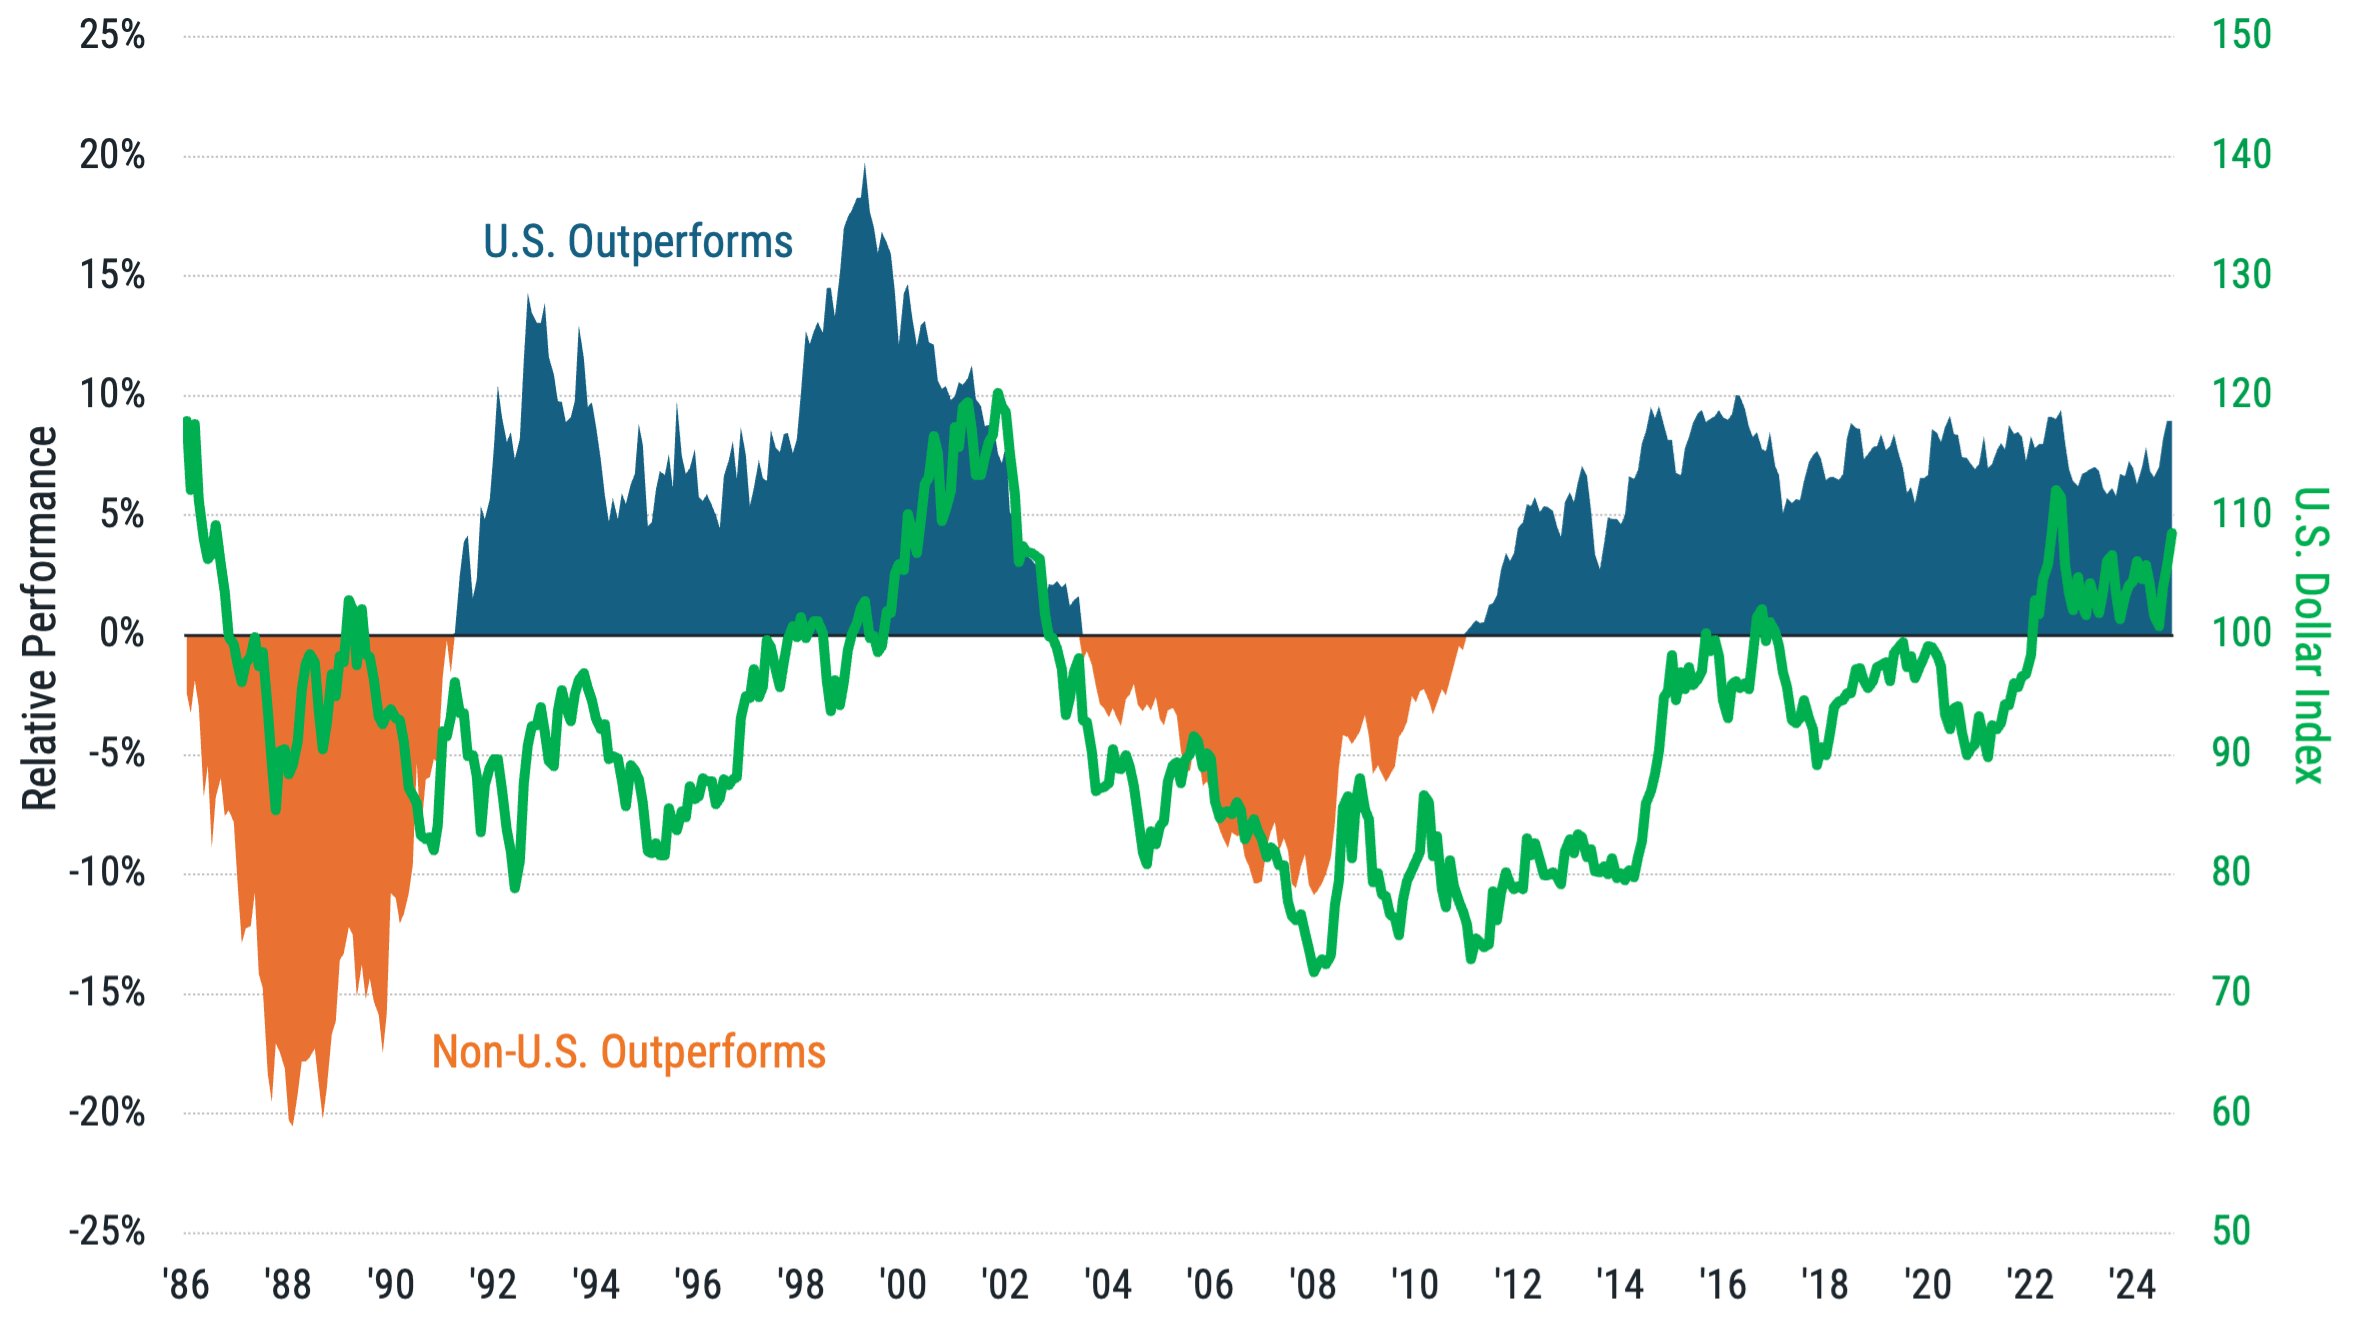
There are 466 five-year rolling return periods computed monthly from 3/31/1986-12/31/2024. U.S. stocks represented by the MSCI USA Index. Non-U.S. Stocks represented by the MSCI World ex-USA Index. U.S. Dollar Index (DXY) from ICE. Source: Bloomberg. Past performance is no guarantee of future results.
Of course, currency is just one component of non-U.S. stock returns, and it’s not known which direction the USD will go in the months and years ahead. What’s clear is that if the dollar weakens further, this should enhance non-U.S. stock returns, and a globally diversified portfolio may stand to benefit.
The Rising Potential for Deglobalization Bears Attention
An additional consideration is the potential effects of shifting global trade dynamics spurred by changing policies. Key uncertainties include:
Will current policy plans stick?
Will there be trade agreements that reduce current or proposed tariffs?
Will other countries retaliate if trade agreements aren’t reached soon?
How will the tariff shakeout impact various global economies and companies?
What plays out may have effects that contribute to the winners and losers among global markets going forward.
For context, Figure 5 shows the enormous magnitude of prior trade between the U.S. and other markets. Panel A shows total imports and exports between the U.S. and all other countries in 2024, along with a few major regions included in the all-country totals. In 2024, the U.S. imported more than $4 trillion of goods and services, while more than $3 trillion was exported to other nations.
Figure 5 | Trade Between the U.S. and Other Countries Was Massive in 2024
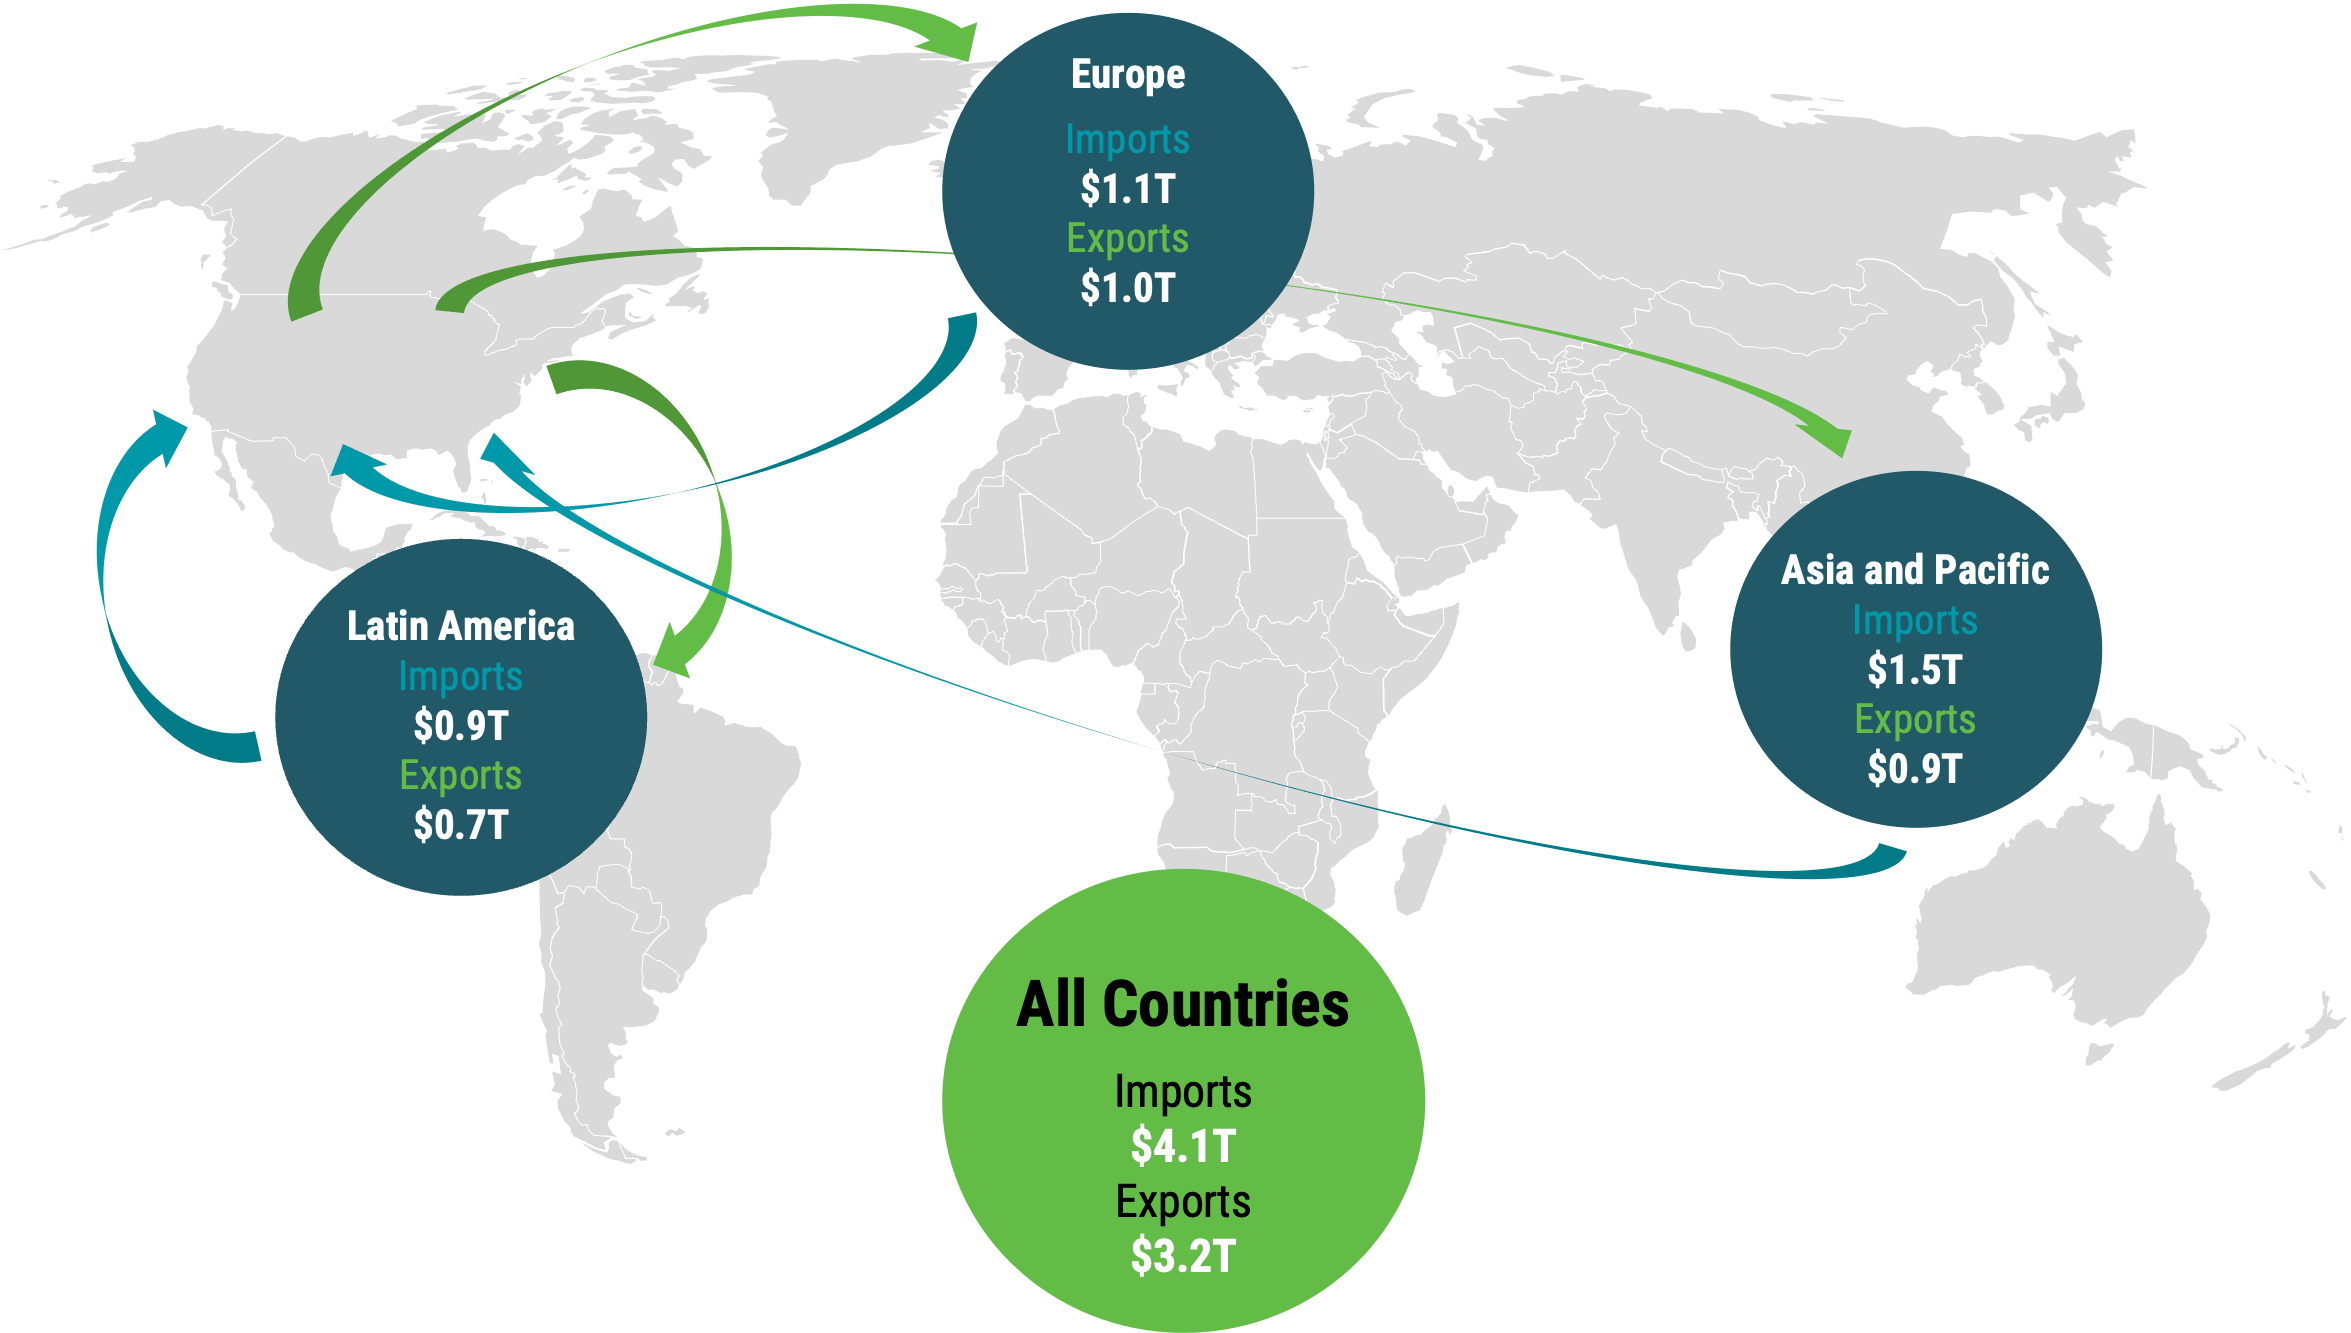
Data as of 12/31/2024. Source: U.S. Bureau of Economic Analysis.
Panel B shows the same data for the 10 largest trade partners to the U.S. based on total imports in 2024. More than $400 billion was imported to the U.S. from Mexico, Canada and China, and about $200 billion or more was exported to each of these countries.
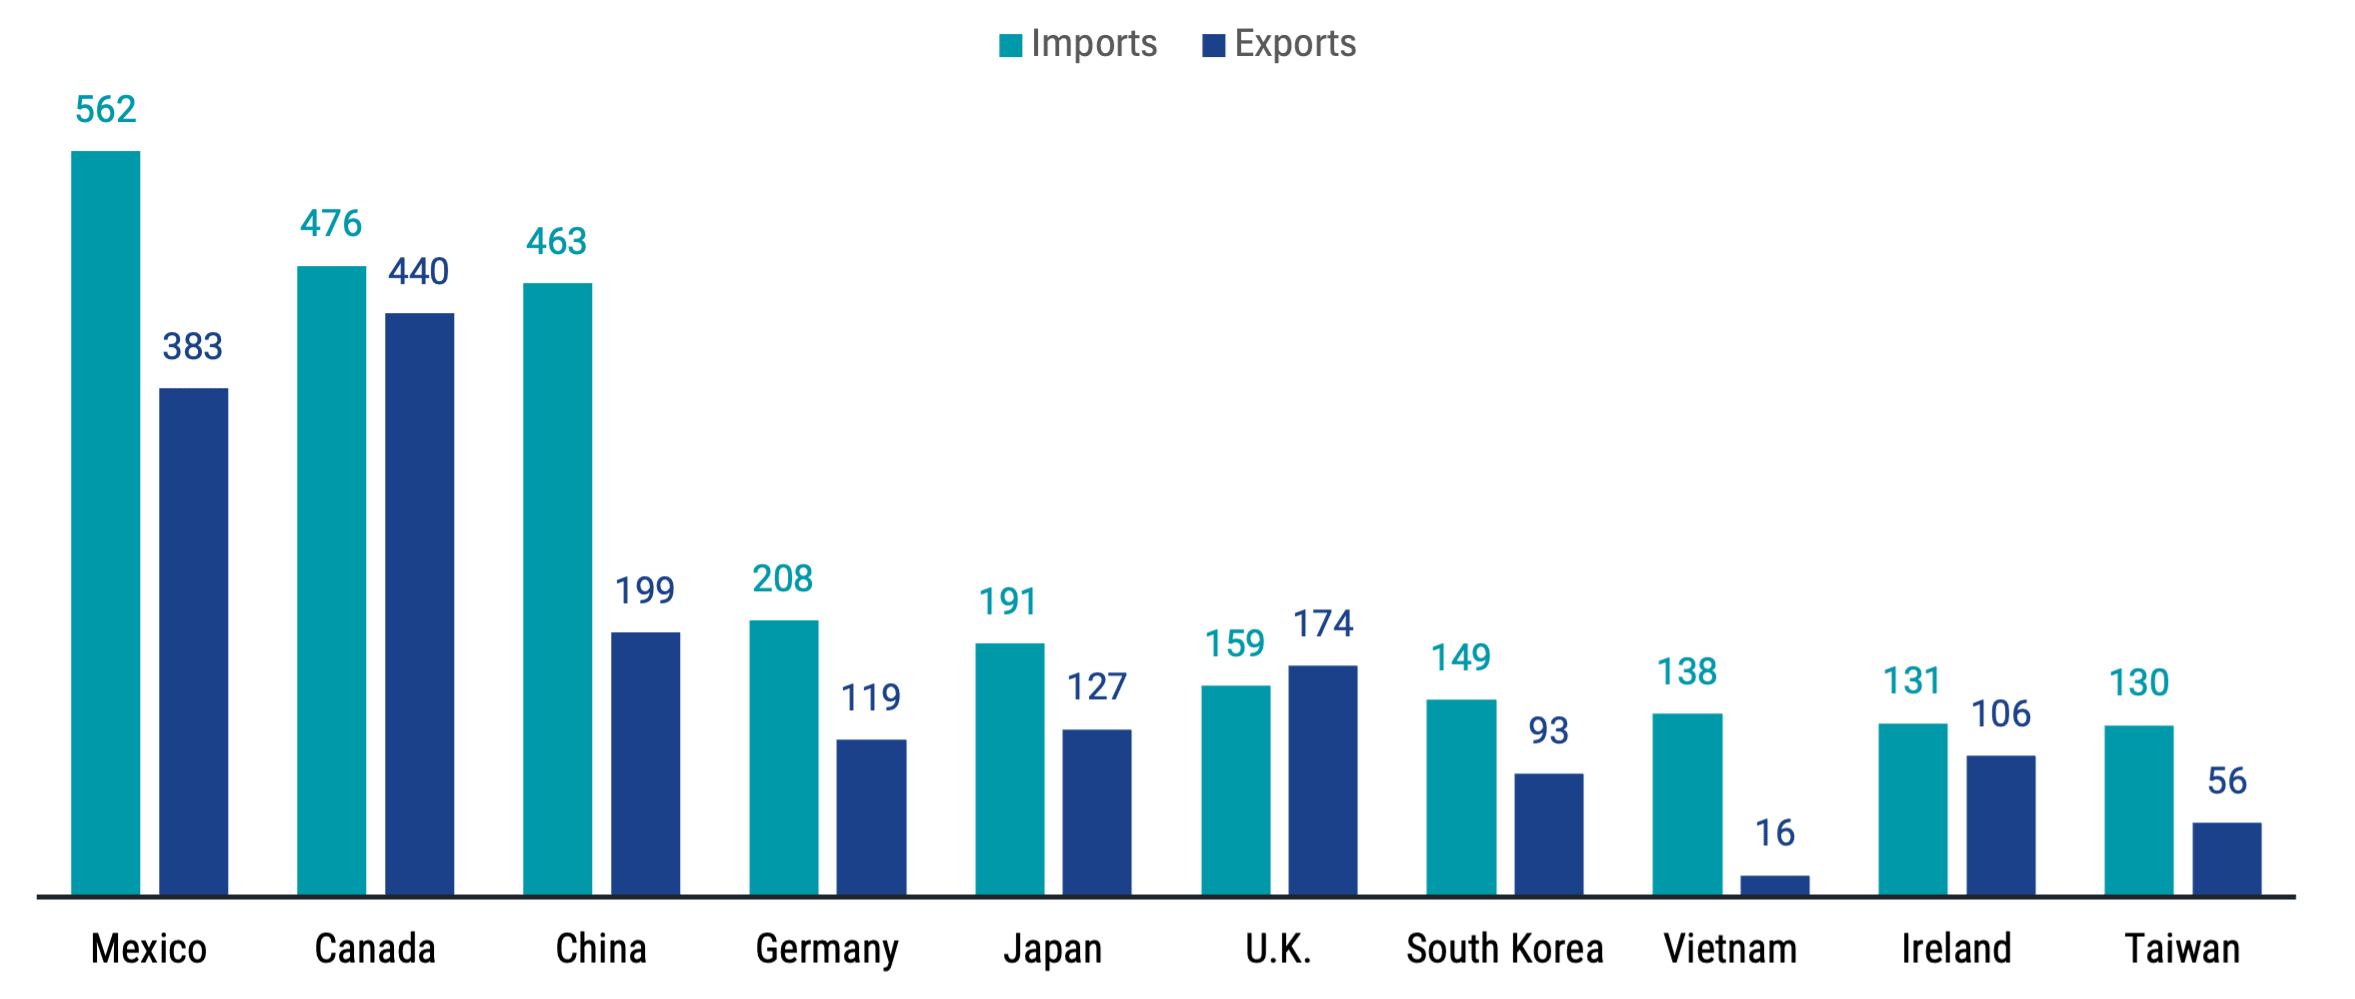
Data as of 12/31/2024. Source: U.S. Bureau of Economic Analysis.
All told, global trade topped $33 trillion in 2024 — an all-time record.2 But trade is not the only channel through which global economies are linked. There’s also investment.
As shown in Figure 6, U.S. residents hold trillions of dollars in non-U.S. stocks and bonds while non-U.S. residents also hold trillions in U.S. securities. And as investments from one country are placed in others, they may also participate in the growth experienced in other markets as their capital is put to work.
Figure 6 | Investment Is Also a Global Game
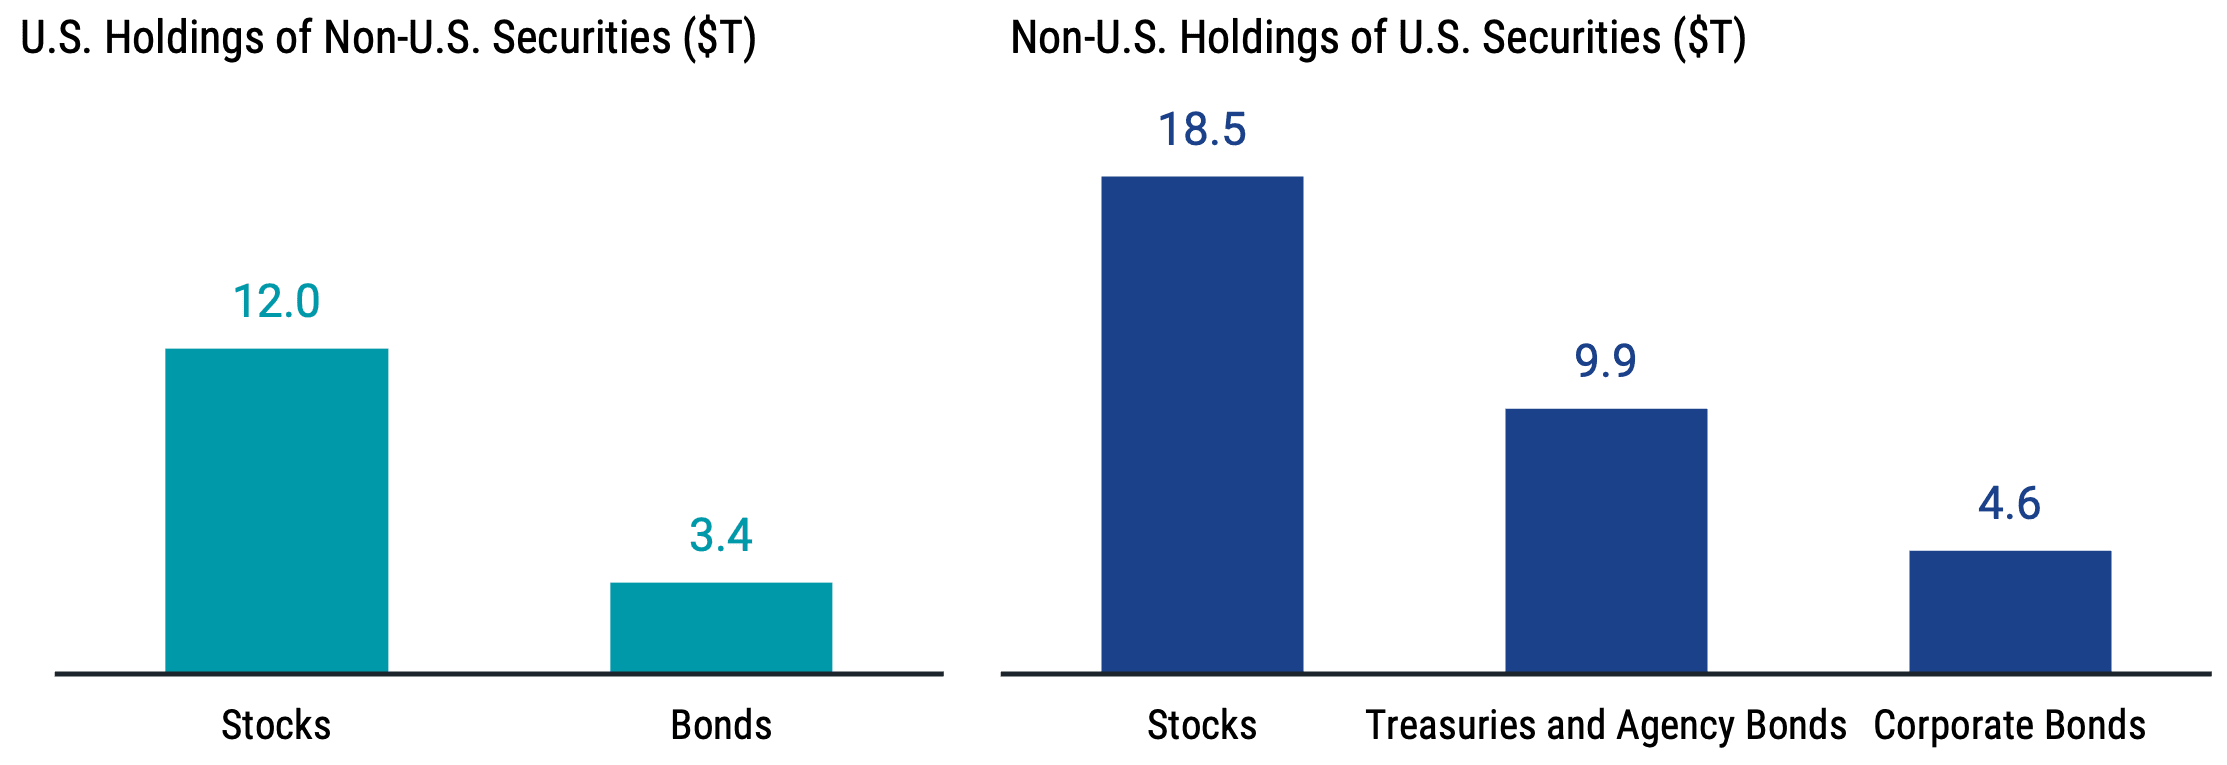
Data as of 12/31/2024. Source: Board of Governors of the Federal Reserve System.
The numbers in Figures 5 and 6 highlight the significant role that cross-country trade and investment have played in global economic growth. Countries worldwide have become increasingly integrated over time. Most nations depend heavily on others to deliver consumer goods and services and to receive capital for growth.
Higher tariffs and other trade barriers between the world's largest economy and other countries, if sustained over a prolonged period, are expected to decrease trade of goods and services entering and exiting the U.S. and have deglobalizing effects.
We already see evidence of this. For example, freight vessels bound to arrive in Southern California ports from China during the week ending May 3 were down 44% from a year earlier.3
In the Face of Uncertainty, Diversification Can Be Your Friend
To be clear, the merits of global diversification were strong before the uncertainty surrounding global trade emerged. Recent events only provide new considerations that point back to the potential risk management benefits of spreading our portfolios across the broader opportunity set.
For those who have previously decided to invest all or most of their equity portfolio in U.S. stocks, we believe a prudent next step is to check in to make sure that allocation serves their long-term goals and risk tolerance.
Explore More Insights
Glossary
ICE U.S. Dollar Index: A measure of the value of the United States dollar relative to a basket of foreign currencies. The U.S. Dollar Index goes up when the U.S. dollar gains strength (value) compared to other currencies.
MSCI ACWI Index: A capitalization-weighted index that is designed to measure the equity market performance of developed and emerging markets.
MSCI ACWI ex-USA Index: A market capitalization-weighted index that is designed to measure the equity market performance of developed and emerging markets, excluding the United States.
MSCI USA Index: A market capitalization-weighted index designed to measure the performance of the large and mid-cap segments of the U.S. market.
MSCI World ex USA IMI Index: Captures large-, mid- and small-cap representation across 22 of 23 developed markets countries, excluding the U.S.
S&P 500® Index: A market-capitalization-weighted index of the 500 largest U.S. publicly traded companies. The index is widely regarded as the best gauge of large-cap U.S. equities.
Jeffrey Ptak, “How Far Out-Of-Whack Are Fund Investors’ Asset Allocations? $800 Billion, Give or Take,” Morningstar. January 22, 2025.
U.N. Trade & Development, “Global Trade Hits Record $33 Trillion in 2024, Driven by Services and Developing Economies,” March 14, 2025.
Lori Ann LaRoco, “Chinese Freight Ship Traffic to Busiest U.S. Ports, Los Angeles, Long Beach, Sees Steep Drop,” CNBC. April 22, 2025.
International investing involves special risks, such as political instability and currency fluctuations. Investing in emerging markets may accentuate these risks.
Diversification does not assure a profit nor does it protect against loss of principal.
Investment return and principal value of security investments will fluctuate. The value at the time of redemption may be more or less than the original cost. Past performance is no guarantee of future results.
This material has been prepared for educational purposes only. It is not intended to provide, and should not be relied upon for, investment, accounting, legal or tax advice.
The opinions expressed are those of the portfolio team and are no guarantee of the future performance of any Avantis fund.
©2026 Morningstar, Inc. All Rights Reserved. Certain information contained herein: (1) is proprietary to Morningstar and/or its content providers; (2) may not be copied or distributed; and (3) is not warranted to be accurate, complete or timely. Neither Morningstar nor its content providers are responsible for any damages or losses arising from any use of this information.