
The Fixed Income Marketplace: Rates, Carry and Roll


Interest rates have increased in the U.S. in Q1 2021. What’s important for investors to consider as they evaluate their fixed income allocations?
With the recent increases in interest rates, investors may be contemplating any impact this development may have on their fixed income allocations. In this short article, we attempt to provide additional perspective surrounding the current fixed income landscape.
Figure 1 | U.S. Treasury Curve Yield Over Time (%)
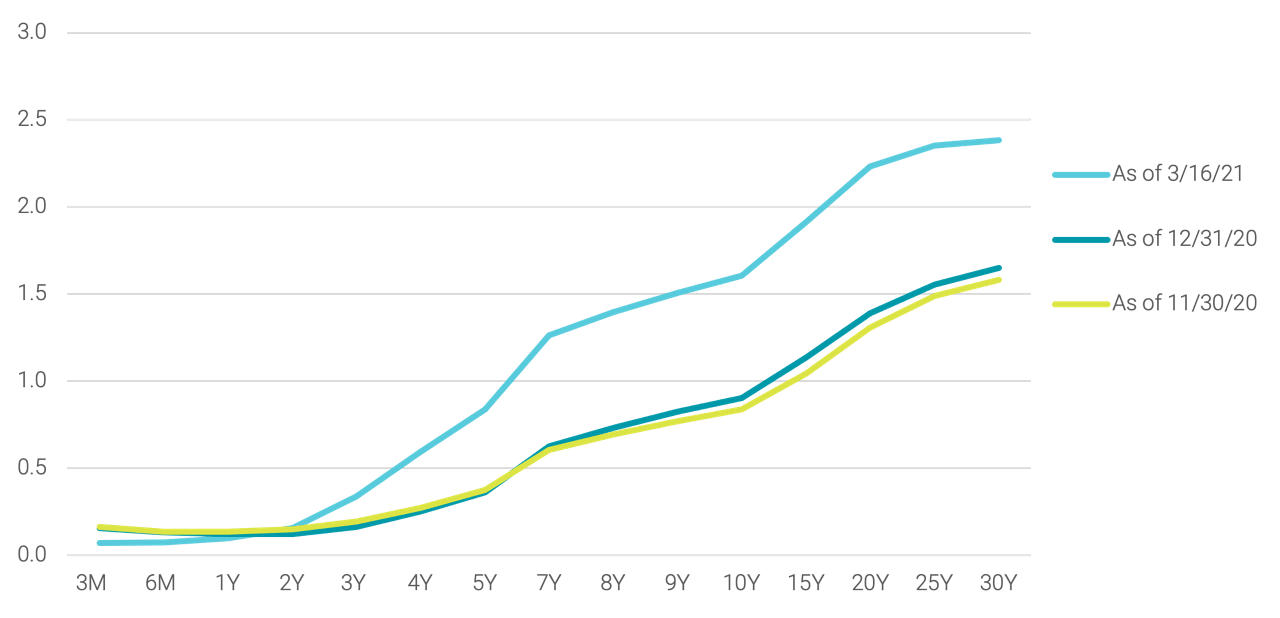
Data as of 3/16/2021. Source: Avantis Investors, data from Bloomberg.
Since the end of 2020, yields have increased across maturities longer than two years, as illustrated in Figure 1. Much of this move higher occurred after mid-February as the 10-year Treasury hit 1.61% in March—an increase of more than 70 basis points (bps). What does this mean for expected returns?
Overall, it means increased expected returns for bonds beyond two years to maturity. In fact, 10-year Treasury yields are now comparable to the S&P 500® Dividend Yield for the first time since the onset of COVID-19.
This has also impacted the relative attractiveness of U.S. yields compared to other non-U.S. curves, as illustrated in Figure 2. While U.S. yields were already more attractive at the beginning of this year, the gap has widened significantly since then.
Figure 2 | U.S. Yields Look Attractive Compared to Global Yields (%)
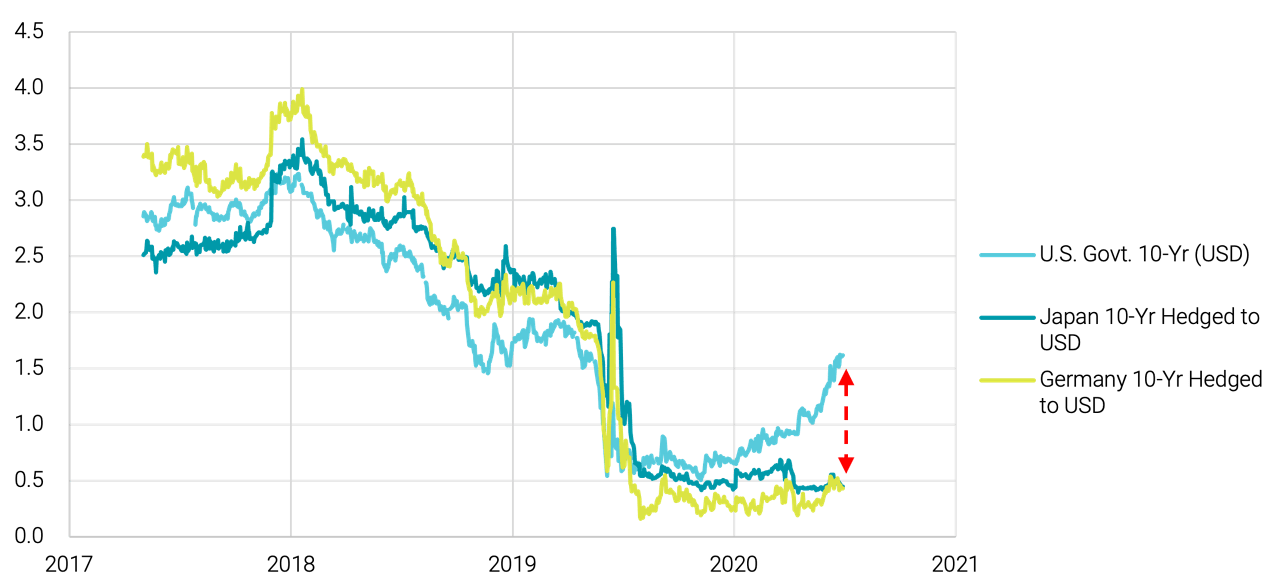
Data from 3/18/2018 – 3/16/2021. Source: Avantis Investors, data from Bloomberg.
By going a level deeper to examine this most recent shift in the U.S. curve, we can gain additional insight. If you recall, rates also increased during Q4 2020, but those increases were primarily focused on longer-dated Treasuries. But the recent shift has had larger relative impact on the intermediate portion of the U.S. yield curve. For example, while both the five-year Treasury and 30-Year Treasury increased by slightly more than 30 bps during February, the jump represented a relative change of 74% (from the initial level) for the five-year versus just 17% for the 30-year.
This shift has contributed to an increase in the relative steepness of the intermediate portion of the curve. While this is observable in Figure 1, it is more evident in Figure 3 where we show two time series. The first (in blue) shows the absolute spread in basis points between the two-year Treasury and 10-year Treasury (commonly referred to as the 2-10 spread). The second time series (in green) shows the 2-10 spread as a percentage of the 10-year rate. The combination of extremely low rates at the short end of the curve and a significant increase in intermediate rates means the relative steepness of the curve (2-10 spread divided by the 10-year rate) is as high as it has been at any point over the last 30 years.
Figure 3 | Two-Year vs. 10-Year Curve at Highest Relative Steepness in 30 Years
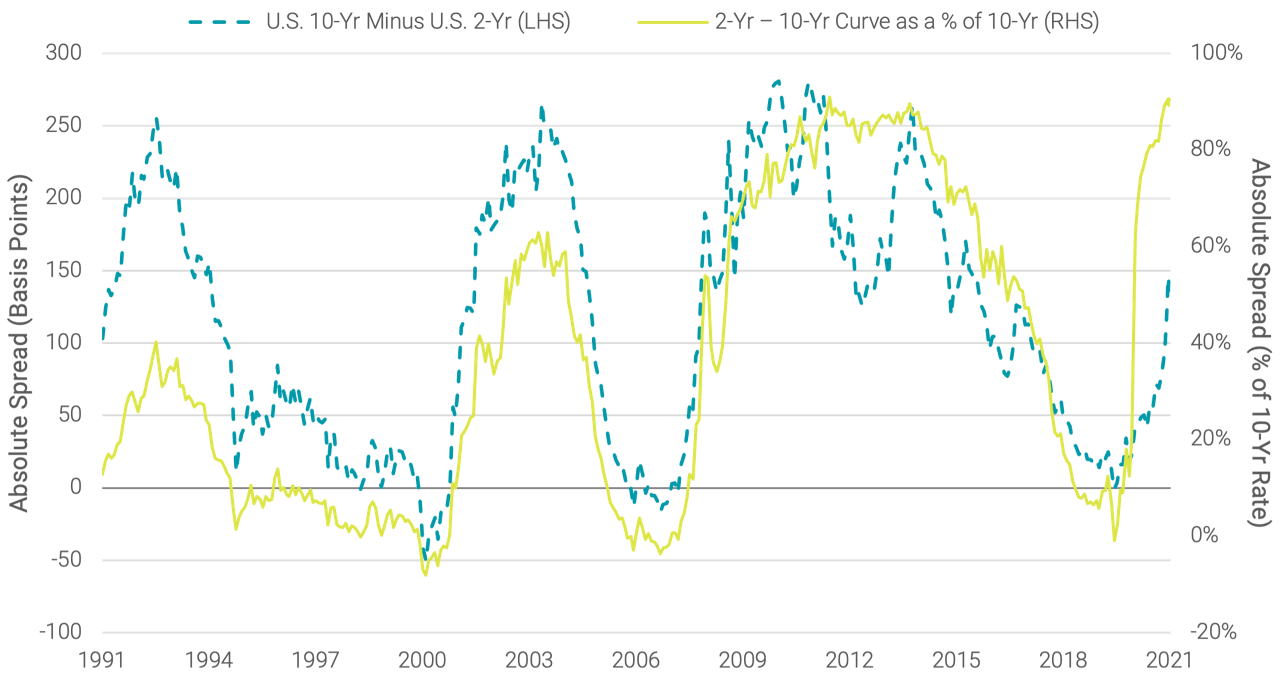
Data from 3/29/1991 – 3/16/2021. Source: Avantis Investors, data from Bloomberg.
The relative steepness of the yield curve today serves as a good reminder for the need to consider both aspects of total return in forming a fixed income strategy—not only current yields, but also the expected capital appreciation from position on the yield curve.
We believe using both criteria when evaluating different bonds within the eligible universe can potentially result in a higher expected return profile for the portfolio. Figure 4 outlines how our process considers these two components together (the current yield, or “carry,” and expected capital appreciation, or “roll”) when making buy and sell decisions.
Figure 4 | Expected Return Considerations
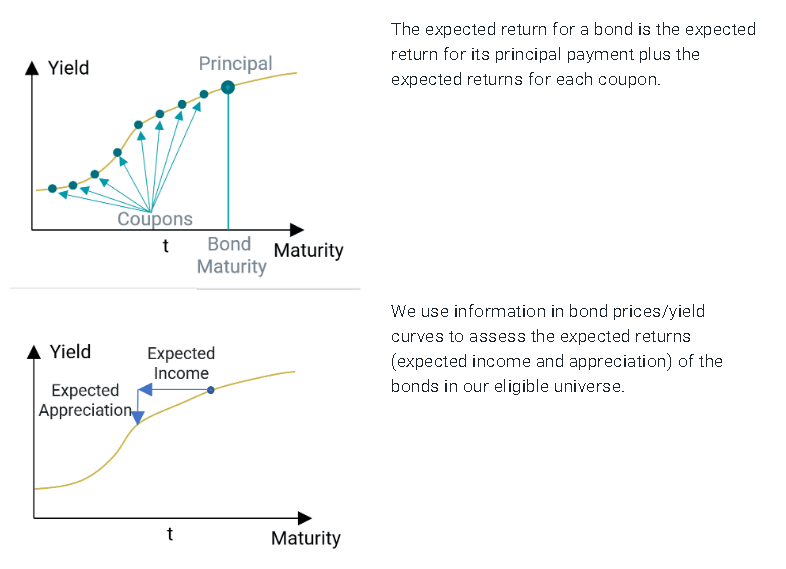
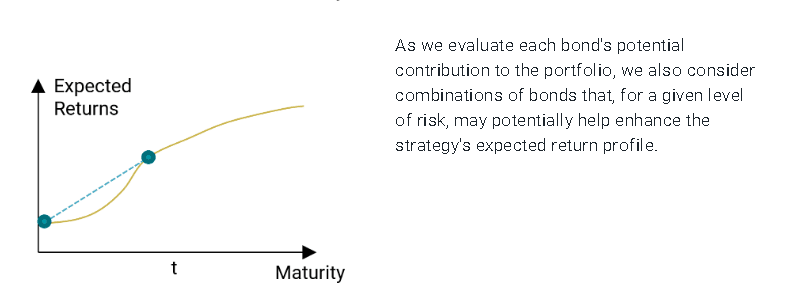
This framework provides a transparent mechanism to evaluate differences in expected returns across bonds, and we can use this information to add value over a simple buy-and-hold to maturity approach.
When combined with sound risk management techniques, such as diversification across issuers and sectors, and credit quality controls using proprietary ratings, we believe it is possible to build fixed income strategies with the potential to offer enhanced value in terms of expected returns, while staying within their overall duration and risk guidelines.
Expected Returns: Valuation theory shows that the expected return of a stock is a function of its current price, its book equity (assets minus liabilities) and expected future profits, and that the expected return of a bond is a function of its current yield and its expected capital appreciation (depreciation). We use information in current market prices and company financials to identify differences in expected returns among securities, seeking to overweight securities with higher expected returns based on this current market information. Actual returns may be different than expected returns, and there is no guarantee that the strategy will be successful.
Past performance is no guarantee of future results.
Our philosophy is based on the idea that paying less for an expected stream of cash flows or the equity of a company should produce higher expected returns. Our systematic, repeatable and cost-efficient process uniquely designed for Avantis Investors is actively implemented to deliver diversified portfolios expected to harness those higher expected returns.
Diversification does not assure a profit, nor does it protect against loss of principal.
This material has been prepared for educational purposes only. It is not intended to provide, and should not be relied upon for, investment, accounting, legal or tax advice.
The opinions expressed are those of the investment portfolio team and are no guarantee of the future performance of any Avantis Investors portfolio. This information is not intended as a personalized recommendation or fiduciary advice and should not be relied upon for investment, accounting, legal or tax advice. References to specific securities are for illustrative purposes only and are not intended as recommendations to purchase or sell securities.
Investment return and principal value of security investments will fluctuate. The value at the time of redemption may be more or less than the original cost. Past performance is no guarantee of future results.
The contents of this Avantis Investors presentation are protected by applicable copyright and trade laws. No permission is granted to copy, redistribute, modify, post or frame any text, graphics, images, trademarks, designs or logos.
FOR FINANCIAL PROFESSIONAL USE ONLY/ NOT FOR DISTRIBUTION TO THE PUBLIC