
Timing Is Everything (if It Works)
As news of Russia’s invasion into Ukraine broke and the scope and scale of the developing conflict became clearer, investors sought to understand its full implications beyond the tragic loss of life and immediate devastation on the people of Ukraine.
Volatility spiked and stocks retreated (although U.S. stocks would recover and end the February 24 trading session in positive territory) as political leaders from the West condemned Russia’s actions and vowed significant sanctions in response.
While Russia makes up a small percentage of the overall global stock market (less than ¼ of 1% as of February 23), Russia and Ukraine both play considerable roles in the production and supply of commodities such as liquid natural gas, wheat, etc. Fears surrounding disruptions in these supply chains were also seemingly exacerbated given the inflationary pressures already present in many developed markets, especially among European countries.
When you add geopolitical conflict of this size into a market backdrop where the S&P 500® Index was already in correction territory (down at least 10% from its previous high) and the NASDAQ was in bear market territory (down at least 20% from its previous high), it would be perfectly normal for investors’ concerns to become elevated.
If we consider a simple valuation framework of Price = Future Earnings/ Demanded Return, we can observe that the two primary reasons why stock prices decrease can be summarized as (1) lower price with no change in expected returns because the company is expected to produce lower profits in the future or (2) lower price with no change in expected profits to accommodate the market demanding a higher expected return in the future.
While the reason can be a combination of varying degrees of these two cases, most of us will agree that in times of market anxiety the market is expected to demand higher returns. Investors would be wise, however, to remember that making rash portfolio decisions in a vacuum can have adverse consequences.
If your asset allocation from a week ago made sense then, what has changed to make it less appropriate today? Avoiding knee-jerk reactions in these scenarios is usually the prudent course. To help quell the fears of those still tempted to temporarily take risk “off the table,” we ran a few experiments to help demonstrate why staying the course has historically been shown to be a good option.
In or Out?
Benchmarking any timing decisions requires evaluating the path not taken. By choosing not to be invested in stocks, we are choosing to be invested in something else (cash, bonds, etc.). We set up some simple experiments using U.S. stocks1 and U.S. Treasury bill returns going back almost 100 years.
It is good to remember that for any market move there are two different timing moves. If the market goes down, some may think it is a buying opportunity (i.e., due to the higher expected returns going forward), while others may want to sell since it may be an early indication of lower future cash flows.
Figure 1 includes a comparison of three hypothetical portfolios. Portfolio 1, the “buy-and-hold” portfolio, maintains an allocation of 50% stocks and 50% T-bills throughout the entire period. The second portfolio, Equity Timing 1, employs a timing strategy. Four times per year, it looks at the return of stocks over the last quarter. If stocks did well (their return was greater than the median quarterly stock return in the sample), it invests 100% in stocks. If stocks didn’t do well (last quarter’s return was less than the median), it invests 100% in T-bills. This is a very simple example of a momentum-based timing strategy.
Equity Timing 2 also has a timing strategy, but it is the opposite of Equity Timing 1. While it also looks at quarterly stock returns, it invests 100% in stocks if last quarter’s return was below median and invests 100% in T-bills if last quarter’s stock return was above median. Equity Timing 2 is a simple example of a contrarian-based timing strategy.
Figure 1 | Buy-and-Hold vs. Equity-Based Timing Strategies
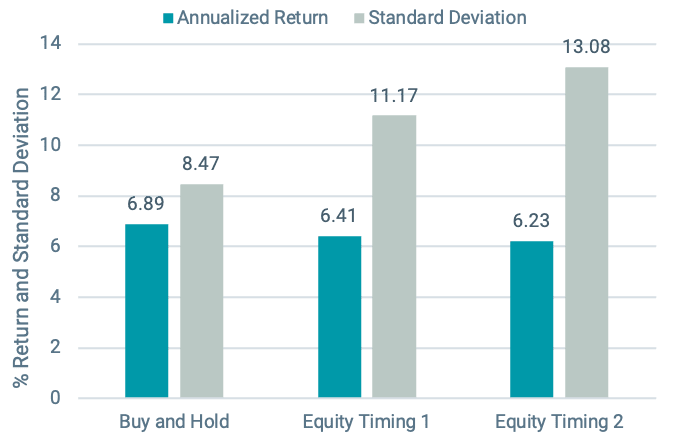
Data from 1/1/1928 – 12/31/2021. Sources: Ken French’s data library and Avantis Investors. Hypothetical illustration only.
How do the timing strategies perform? It is important to note that on average, they all have the same allocation (50% stocks and 50% T-bills), but while Buy and Hold always has a 50/50 split, the timing strategies are either 100% in stocks or 100% in T-bills. The performance across all three portfolios is similar, although both timing strategies lag the buy-and-hold portfolio by a statistically insignificant difference.
Both timing strategies also have significantly higher volatility, which is driven by the periods where they have 100% allocated to stocks (in a chain of events, the riskiest link in the chain drives the overall risk of losses). In this experiment, it doesn’t appear that either timing strategy adds value either from superior returns or reduced volatility.
Figure 2 offers another illustration of how the Buy-and-Hold strategy would have fared versus the timing strategies over the last 90+ years. You can observe the periods where each timing strategy would have allocated to T-Bills as they tend to be flat or slightly upwardly sloped lines. The Buy-and-Hold strategy chugs along with fewer wild swings than either of the timing strategies.
Figure 2 | Growth of $1 - Buy and Hold vs. Equity-Based Timing Strategies
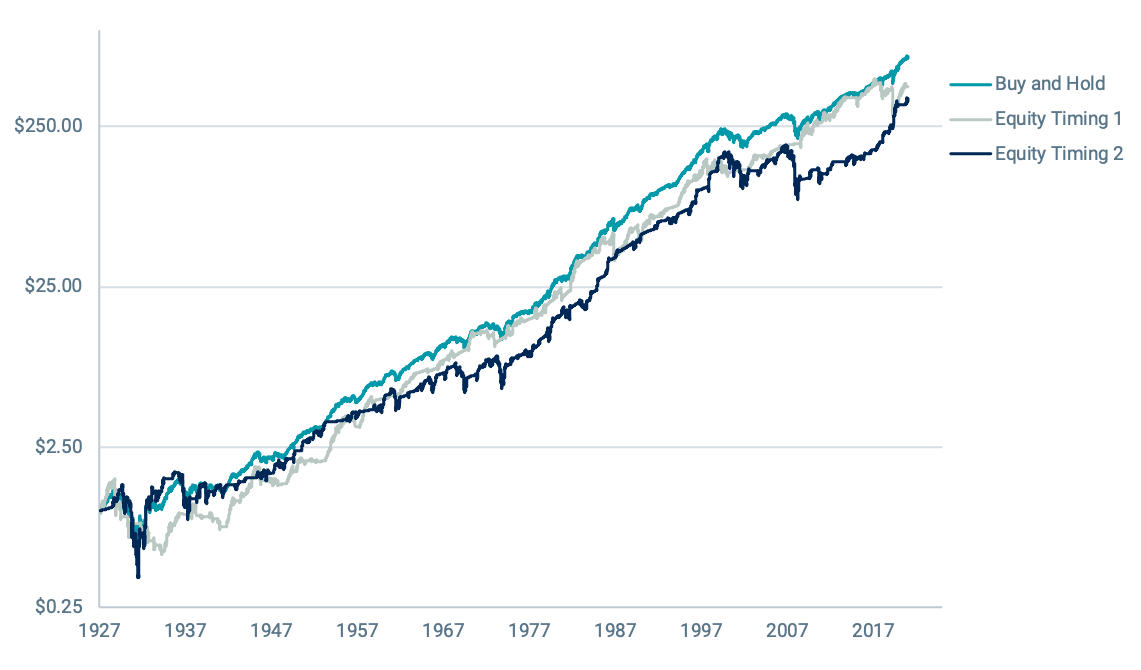
Data from 1/1/1928 – 12/31/2021. Sources: Ken French’s data library and Avantis Investors. Past performance is no guarantee of future results.
What About Volatility-Based Signals?
What happens if we look at volatility-based versus return-based signals? In Figure 3, we do just that. The buy-and-hold portfolio maintains an allocation of 50% stocks and 50% T-bills throughout the entire period. Volatility Timing 1 employs a timing strategy. Four times per year, it looks at the volatility of stocks over the last 90 days. If stock volatility was high (greater than the median 90-day volatility in the sample), it invests 100% in stocks. If volatility was low (less than the median), it invests 100% in T-bills. Volatility Timing 2 also has a timing strategy, but it is the opposite of Volatility Timing 1. While it also looks at volatility, it invests 100% in stocks if that last 90 days’ volatility was below the median and invests 100% in T-bills if the previous 90 days’ volatility was above median.
How do the volatility-based timing strategies stack up? The timing strategy that chooses stocks when volatility has been high has a return similar to the buy-and-hold strategy (6.83% vs. 6.89%) but significantly higher volatility (standard deviation of 14.79% vs. just 8.47% for the buy and hold portfolio).
Volatility Timing 2, the timing strategy that chooses stocks when volatility has been low, has a standard deviation similar to the buy-and-hold strategy, but returns are significantly lower (5.81% vs. 6.89%). Like the equity-based timing strategies, the volatility-based timing strategies do not appear to add value over the buy-and-hold portfolio.
Figure 3 | Buy-and-Hold vs. Volatility-Based Timing Strategies
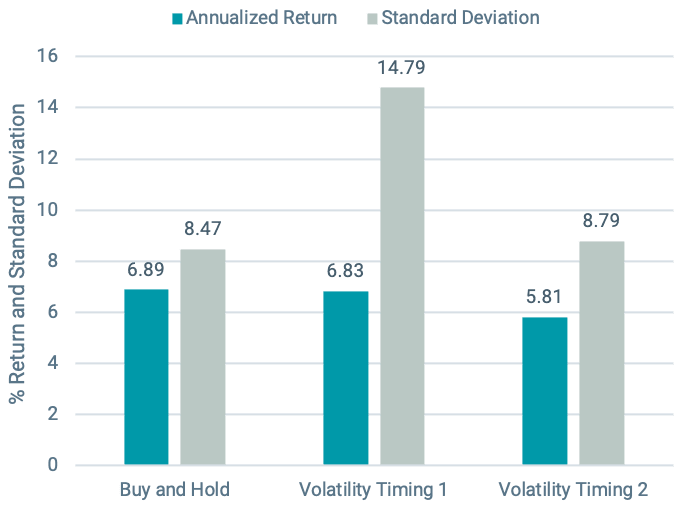
Data from 1/1/1928 – 12/31/2021. Sources: Ken French’s data library and Avantis Investors. Hypothetical illustration only.
In Figure 4, we show the same comparison as Figure 2 but with the volatility-based timing strategies. Once again, it is easy to observe when each of the timing strategies would have held stocks vs. T-Bills based on the relative choppiness or smoothness of each line, versus the Buy and Hold strategy that generally slopes upward with some drawdowns along the way.
Figure 4 | Growth of $1 - Buy and Hold vs. Volatility-Based Timing Strategies
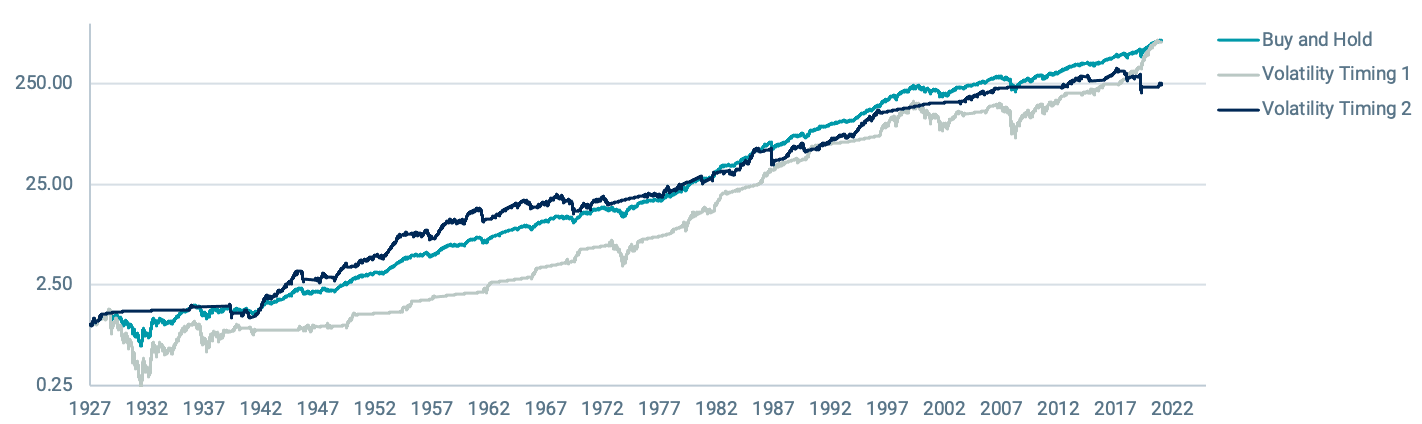
Data from 1/1/1928 – 12/31/2021. Sources: Ken French’s data library and Avantis Investors. Past performance is no guarantee of future results.
Time in the Market vs. Timing the Market
While these are just a few examples of timing strategies, they help illustrate the challenges that can arise from making large shifts to try to time markets. When we face shocking news, it is perfectly natural for us to want to react, but we need to remember that the market already reacted so the known news about the future has already impacted markets and future expected returns.
If we decide to temporarily change our asset allocation and move to the sidelines due to concerns about volatility or the prospects of stock returns, that change involves more than just one decision—we have to choose when to get out and when to get back in.
The hypothetical experiments we have shown here demonstrate that we would have been better off just staying the course than trying to jump in and out—and this is before we consider any taxes or transactions costs (which would likely further tilt the odds in the favor of the buy-and-hold strategy). As the saying goes, time in the market is more important than timing the market.
1U.S. stocks are represented by the CRSP U.S. Total Market Index, which consists of nearly 4,000 constituents across mega, large, small and micro capitalizations, representing nearly 100% of the U.S. investable equity market.
Glossary
CRSP U.S. Total Market Index. Consists of nearly 4,000 constituents across mega, large, small and micro capitalizations, representing nearly 100% of the U.S. investable equity market.
S&P 500® Index.A market-capitalization-weighted index of the 500 largest U.S. publicly traded companies. The index is widely regarded as the best gauge of large-cap U.S. equities.
Standard Deviation. A statistical measurement of variations from the average. In financial literature, it's often used to measure risk, when risk is defined in terms of volatility. In general, a higher standard deviation means more volatility, and more volatility means more risk.
This material has been prepared for educational purposes only. It is not intended to provide, and should not be relied upon for, investment, accounting, legal or tax advice.
Investment return and principal value of security investments will fluctuate. The value at the time of redemption may be more or less than the original cost. Past performance is no guarantee of future results.
Diversification does not assure a profit nor does it protect against loss of principal.
It is not possible to invest directly in an index.