
3 Storylines Behind the Market in 2023

Broad U.S. stock market returns in 2023 offer welcome news for investors at the surface. As measured by the Russell 3000® Index, the U.S. market was up nearly 9% at the end of May — well above the market’s long-term average monthly return of about 1%.
Yet, this masks several major headlines that have faced markets — ongoing fears with certain regional banks and the U.S. debt limit showdown, to name a couple — and other notable storylines that emerge when you look under the hood.
Growth Stocks Are Getting Pricier
Peel back the onion on U.S. stock market returns in 2023, and we see a wide disparity between U.S. large growth and the rest of the market. The dispersion in returns between U.S. small value stocks (-5%) and U.S. large growth (21%) is around 25% on the year. See Figure 1.
Figure 1 | U.S. Growth Stocks Have Driven Market Returns Since March
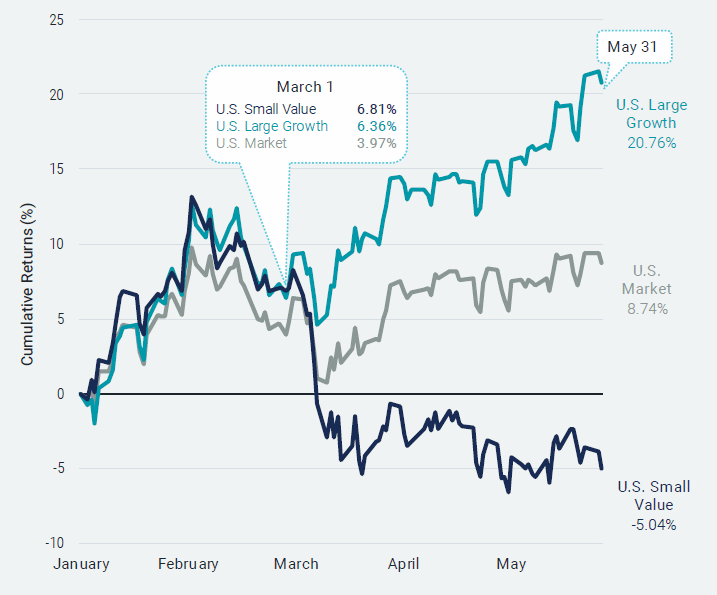
Data from 1/1/2023 - 5/31/2023. Source: Avantis Investors, Morningstar. U.S. stocks are represented by the Russell 3000 Index. U.S. large growth stocks are represented by the Russell 1000® Growth Index. U.S. small value stocks are represented by the Russell 2000® Value Index.
Despite the sizeable differential year to date, we only have to look back to March 1 — just before news broke of troubles in the regional banking sector — to find a time that small value was outpacing both large growth and the broader market on the year. In short, markets can move quickly.
At the end of March 1, small value stocks were ahead of large growth stocks by nearly 0.50%. Since then, we’ve seen things go the other direction, with large growth returns driven largely by outsized returns from a handful of the market’s biggest companies.
For context, by May 31, the 10 largest companies in the S&P 500® Index had gained 44% on the year, while the rest of the companies in the index posted a slightly negative return.¹ Think back a few years, and you may recall this is a story we’ve seen before.
Valuations help put this period into perspective. Figure 2 shows price-to-earnings (P/E) and price-to-book equity (P/B) ratios for large growth and small value stocks over the first five months of 2023.
Figure 2 | Large Growth Valuations Are on the Rise
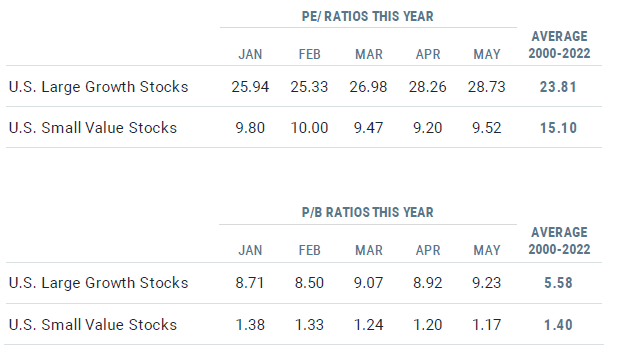
Data from 1/1/2000 - 12/31/2022. Source: Avantis Investors, Morningstar. U.S. large growth stocks are represented by the Russell 1000 Growth Index. U.S. small value stocks are represented by the Russell 2000 Value Index.
We compare that to the respective long-term averages from the start of 2000 through the end of 2022. Each ratio tells us how prices compare to underlying company fundamentals (i.e., higher ratios mean higher prices relative to fundamentals).
It’s clear that whether looking at P/E or P/B, large growth valuations have increased over the year and stand well north of their longer-term averages taken just before this year began.
Those mega-cap companies that have performed well above the market this year have been a driving force behind this. Consider that the P/E for the four largest companies in the U.S. market ranged from the 30s to more than 200 at the end of May. In contrast, small value multiples have declined and are below long-term averages.
Why does this matter? Prices shouldn’t rise or fall forever, irrespective of fundamentals. Sooner or later, fundamentals should matter. Generally, lower prices today, as in the case of small value stocks, should mean higher expected returns* in the future.
Research has shown some relation between valuation ratios and future returns. The good news for small value investors is that when differences between valuation ratios of growth and traditional value stocks are high, we expect the premium for lower-priced companies to be higher than the average going forward.²
Global Stocks Are Up, but International Lags the U.S. Again
Taking a broader look at stock returns in 2023, Figure 3 shows that markets are up worldwide year to date. However, as has often been the case in recent years (with 2022 as the most recent exception), U.S. stocks have outperformed international stocks thus far.
Figure 3 | U.S. Stocks Have Led the Way in 2023, but International Stocks Trade at Lower Valuations
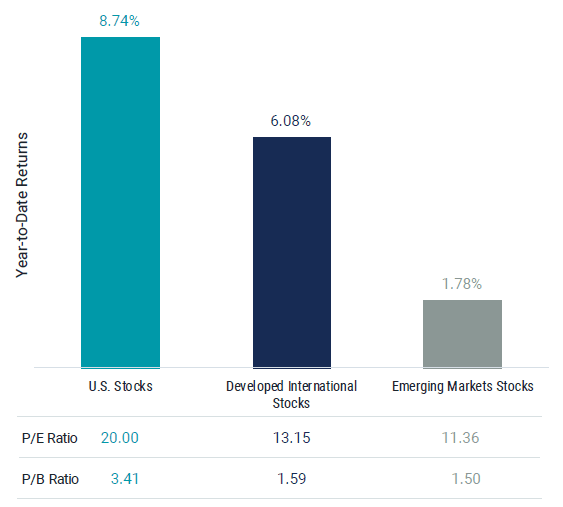
Cumulative Returns from 1/1/2023 - 5/31/2023. Price-to-Earnings (P/E) and Price-to-Book (P/B) as of 5/31/2023. Source: Avantis Investors, Morningstar. U.S. stocks are represented by the Russell 3000 Index. Developed international stocks are represented by the MSCI World ex USA IMI Index. Emerging markets stocks are represented by the MSCI Emerging Markets IMI Index.
But sticking with our theme that valuations matter, we also include valuation metrics for U.S. and international markets in Figure 3. We observe that international stocks are trading at lower prices versus fundamentals than U.S. stocks, whether looking at developed or emerging markets. Again, lower P/E and P/B ratios may indicate more attractive expected returns for international stocks.
While it may not be easy for investors to stay the course with globally diversified portfolios over long periods of U.S. outperformance, we’ve also seen long periods historically when international stocks have outperformed U.S. stocks.
We don’t know when these periods will start or end. Still, current valuations offer some support for sticking with an allocation to international stocks and embracing the potential benefits of global diversification.
Many Investors Still Sit on the Sidelines
Despite what might seem like pretty calm markets if you only look at broad market returns over the year, investor activity tells a different story. Between the start of March and May 24, investors pulled out over $100 billion from U.S.-based stock funds and allocation funds, which typically include stocks and bonds, while nearly $500 billion was added to government money market funds. See Figure 4.
Figure 4 | Funds Investing in Stocks Have Seen Net Outflows Since March 1
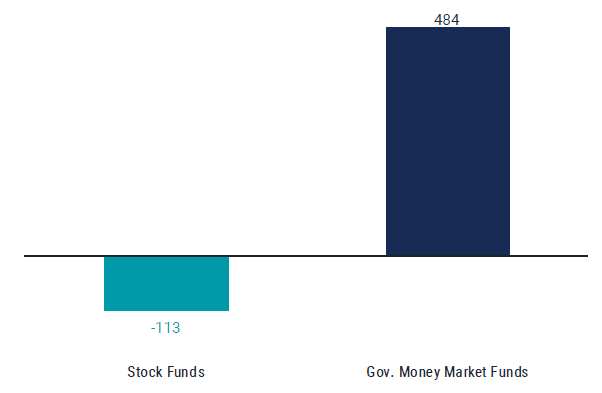
Data from 3/1/2023 - 5/24/2023. Source: ICI. Stock funds represent US-domiciled mutual funds and ETFs investing in stocks or a combination of stocks and bonds.
There’s more going on here than just money moving from stock funds into money market funds. Deposits taken from banks have likely played a role. Still, it’s also worth noting that deposit levels, shown in Figure 5, have generally stabilized over the last two months following government action to help put depositors at ease.
Figure 5 | U.S. Bank Deposits Have Stabilized Since Late March
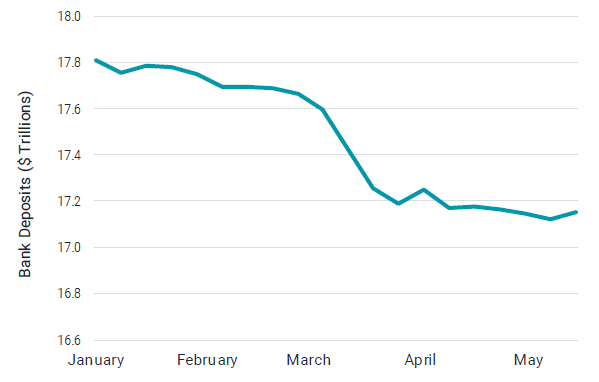
Data from 1/4/2023 - 5/17/2023. Source: Federal Reserve Economic Data (FRED).
The patterns we see from investor activity suggest that at least a segment of investors have likely acted on anxiety and uncertainty rather than maintaining the discipline to stick to a well-formed financial plan that suits their risk tolerance.
Given the returns from global stock markets this year, it’s likely safe to say that investors who have left the market for the perceived safety of government money market funds haven’t fared better than had they stuck with it.
Times change, and so do the day's storylines, but it’s helpful to remember that basic investing principles endure. Valuations matter, and so does investing for the long term.
Explore More Insights
Related Insights
*Expected Returns: Valuation theory shows that the expected return of a stock is a function of its current price, its book equity (assets minus liabilities) and expected future profits, and that the expected return of a bond is a function of its current yield and its expected capital appreciation (depreciation). We use information in current market prices and company financials to identify differences in expected returns among securities, seeking to overweight securities with higher expected returns based on this current market information. Actual returns may be different than expected returns, and there is no guarantee that the strategy will be successful.
Glossary
MSCI Emerging Markets IMI Index: Captures large-and mid-cap securities exhibiting overall value style characteristics across 27 emerging markets countries. The value investment style characteristics for index construction are defined using three variables: book value to price, 12-month forward earnings to price, and dividend yield.
MSCI World ex-USA IMI Index: Captures large-, mid- and small-cap representation across 22 of 23 developed markets countries, excluding the U.S.
Price-to-Book Ratio (P/B): Measures a company’s current market price relative to its book value. It is calculated by dividing the stock price per share by book value per share. Book value is generally a firm’s reported assets minus its liabilities on its balance sheet.
Price-to-Earnings Ratio (P/E): Measures a company’s current market price relative to its earnings. It is calculated by dividing the stock price per share by earnings per share.
Russell 1000® Growth Index: Measures the performance of those Russell 1000® Index companies (the 1,000 largest publicly traded U.S. companies, based on total market capitalization) with higher price-to-book ratios and higher forecasted growth values.
Russell 2000® Value Index: Measures the performance of those Russell 2000® Index companies (the 2,000 smallest of the 3,000 largest publicly traded U.S. companies, based on total market capitalization) with lower price-to-book ratios and lower forecasted growth values.
Russell 3000® Index: Measures the performance of the largest 3,000 U.S. companies representing approximately 98% of the investable U.S. equity market.
S&P 500® Index: A market-capitalization-weighted index of the 500 largest U.S. publicly traded companies. The index is widely regarded as the best gauge of large-cap U.S. equities.
Jon Sindreu, “Have Megafirms Like Nvidia Grown Too Big? Investors Believe They Are Only Getting Started,” Wall Street Journal, May 31, 2023.
Sunil Wahal, “The Value Spread and the Value Premium,” Avantis Investors, February 2020.
Diversification does not assure a profit nor does it protect against loss of principal.
Historically, small- and/or mid-cap stocks have been more volatile than the stock of larger, more-established companies. Smaller companies may have limited resources, product lines and markets, and their securities may trade less frequently and in more limited volumes than the securities of larger companies.
International investing involves special risks, such as political instability and currency fluctuations. Investing in emerging markets may accentuate these risks.
It is not possible to invest directly in an index.
Investment return and principal value of security investments will fluctuate. The value at the time of redemption may be more or less than the original cost. Past performance is no guarantee of future results.
This material has been prepared for educational purposes only. It is not intended to provide, and should not be relied upon for, investment, accounting, legal or tax advice.
©2025 Standard & Poor's Financial Services LLC. The S&P 500® Index is composed of 500 selected common stocks most of which are listed on the New York Stock Exchange. It is not an investment product available for purchase.
Contact Avantis Investors
inquiries@avantisinvestors.com
This website is intended for Institutional and Professional Investors, not Retail Investors.