Weathering the Storm

Key Takeaways
Increased market volatility in early 2025, driven by fears around new trade policies, inflation and a weakening dollar, led to a 4% drop in the S&P 500® Index.
The discount rate on future earnings tends to increase in turbulent times, causing stock prices to drop as investors become more cautious.
Despite recent declines, historical trends indicate that positive returns could follow.
In stormy skies, we can trust that the sun still shines beyond the clouds and in time will return to brighten our day. However, in the moment, risk aversion may compel us to prepare for the worst.
Investors are experiencing the same in the market today. Prices on U.S. stocks have gone down, and volatility has risen as investors grapple with uncertainty around new trade policy and its potential impacts, inflation fears, a weakening dollar, etc.
During the first quarter of 2025, the S&P 500® Index fell a little more than 4%, but after reaching an all-time high on February 19, it lost more than 10% at one point in March. Not all companies and segments of the market contributed equally, with the many of the Magnificent 7 companies and large growth indexes more broadly representing the largest declines for the period.
So why have prices gone down? We can think of company prices as the discounted value of the future earnings the company will generate. The level at which these earnings are discounted, or the discount rate applied to companies, isn’t expected to be constant through time. Instead, it can depend on the environment.
In turbulent and uncertain times, we should expect investors to be more cautious and demand higher rewards for taking risks. If the discount rate on future earnings goes up, company prices and the overall stock market will also go down.
We have seen this play out in history. We aren’t in unseen times. Of course, every time is different in some ways, with new issues and considerations on investors’ minds, but the principles governing prices and rewards remain.
Historically, in times of anxiety, those who have maintained control of their emotions and avoided overreacting in the moment have tended to fare better than those who didn’t. To help investors today remain calm and find the sun in the clouds, we offer a few reminders for investing during uncertain times.
Recent Declines Don’t Guarantee More Declines Ahead
A great benefit we have today is a long history of readily available market returns from which we can observe how the market has behaved in the past. We all know the saying that past returns are no guarantee of future returns. And, while we know it, we often take this reality for granted. Now is a great time to pay attention.
Using nearly 100 years of market data, we can examine the relationship between returns over a given period and the returns that follow right after. To provide context relevant to what investors have experienced lately, we computed U.S. stock returns over 100-day periods going back to 1926 versus returns in the subsequent 100 days (i.e., the last 100 days versus the next 100 days).
We plot the results in Figure 1. Panel A shows all periods, while Panel B focuses specifically on periods with declines of 10% or more over the last 100 days (i.e., all periods and then periods similar to what investors face today).
What do we find in the results? More clouds. But this time, it’s a welcomed sight. The cloud-like patterns formed by the observations in Panels A and B demonstrate that recent returns don’t predict future returns. Notably, the bad times aren’t consistently followed by more bad times.
Figure 1 | Recent Returns Don’t Predict Future Returns
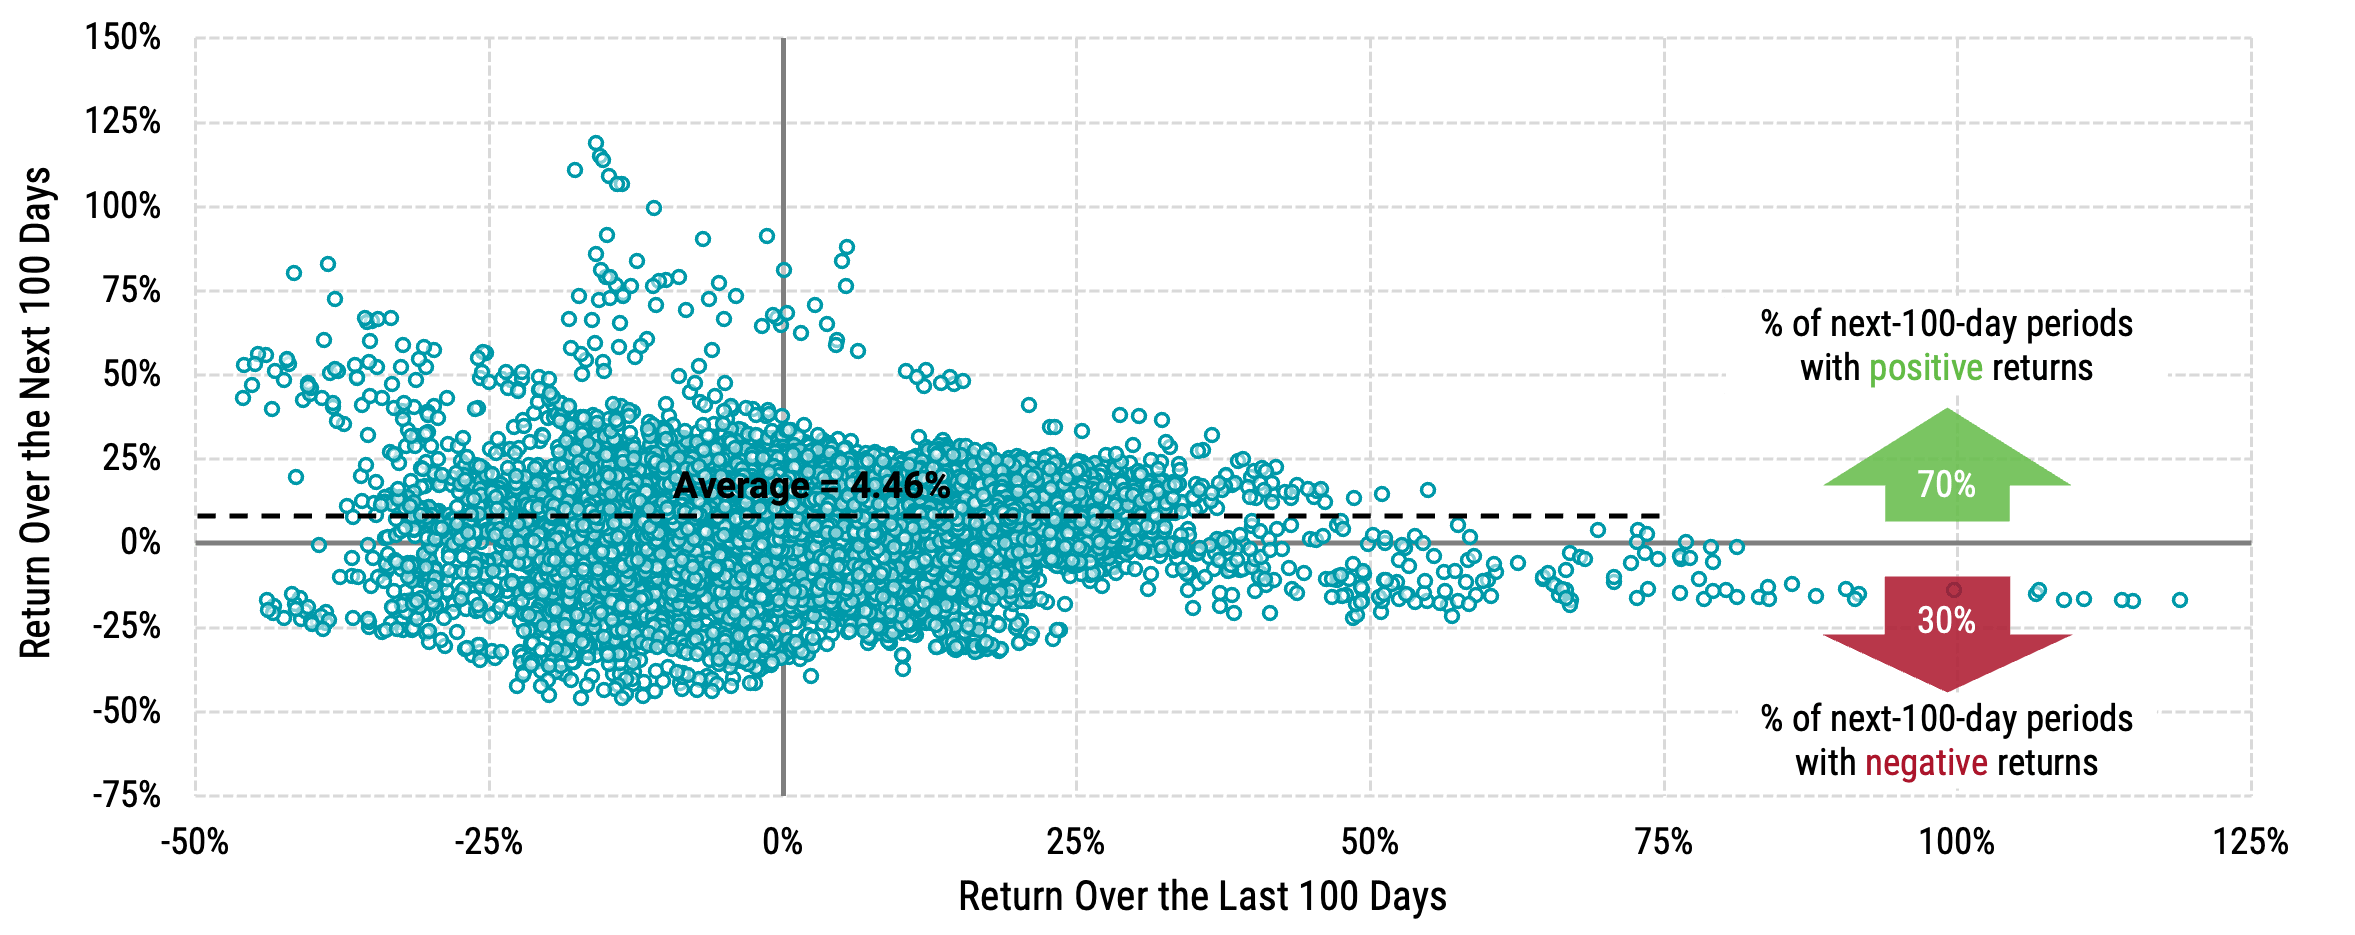
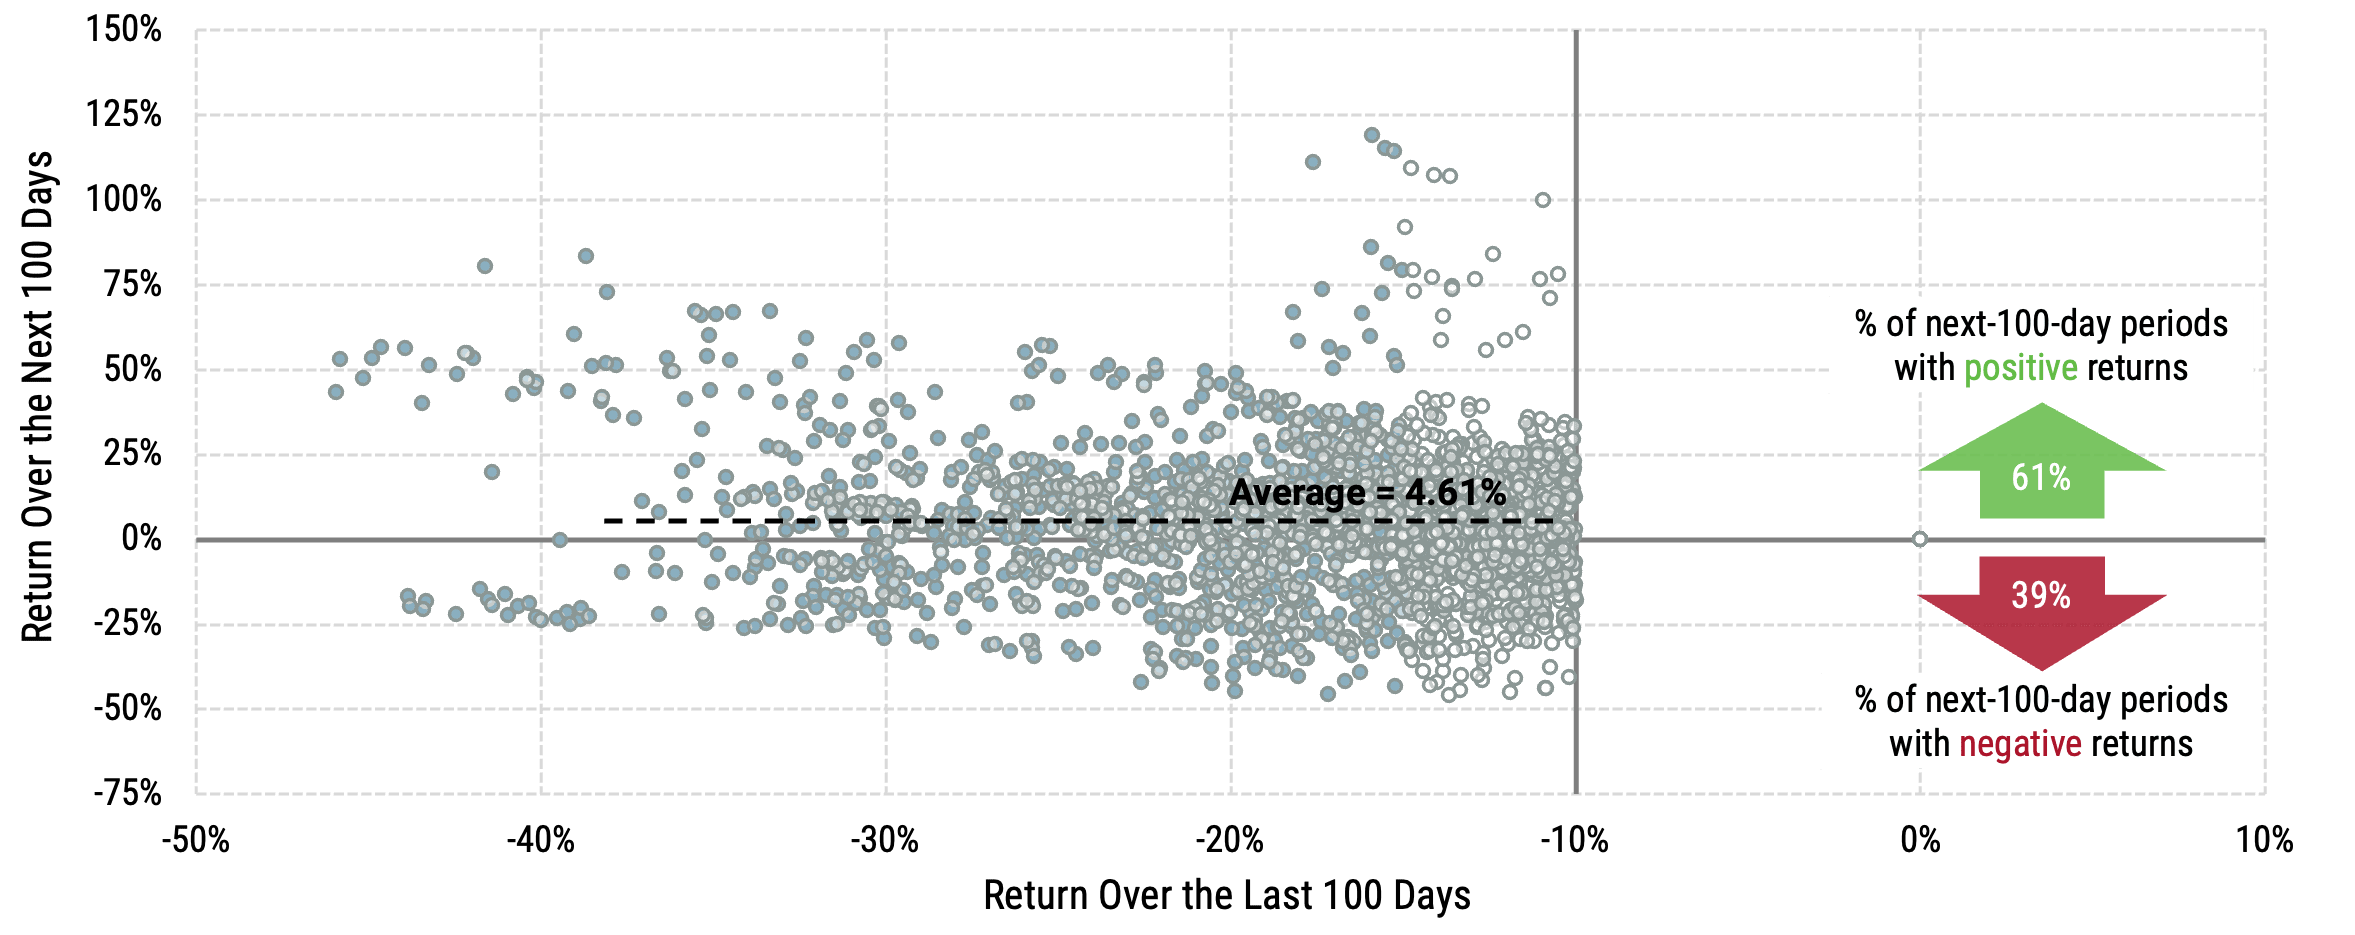
Data from 7/1/1926 - 2/28/2025. U.S. stocks sourced from the Center for Research in Security Prices (CRSP) include all firms incorporated in the U.S. and listed on the NYSE, AMEX or NASDAQ. Source: Avantis Investors. Past performance is no guarantee of future results.
When we look at all past 100-day periods for U.S. stocks (Panel A), 70% of the time, the market delivered a positive return afterward, and the average return for all periods was 4.46%. This number annualizes to about 11% — in line with the long-term annual average from the U.S. market.
When we focus on periods with declines of 10% or more (Panel B), we still see that positive returns follow more often than not, but the higher uncertainty of these times also plays a role. The frequency of positive subsequent returns reduces slightly to 61%, but we also find higher average returns after drawdowns!
Missing the Market Recovery Can Really Hurt
A critical point to remember is that when we experience market declines, we don’t know when the bottom will occur. If we could avoid being invested when the market is going down and then get back in when the market starts to go back up, that would be fantastic. But without a crystal ball, that isn’t easy to pull off. The major risk we face attempting to time the market around drawdowns is that we may miss out on benefiting from the recovery.
This risk shouldn’t be underestimated. Figure 2 provides useful context.
Figure 2 | When Markets Recover, It’s Often in a Hurry: Average Return Over 100-Day Periods After a Decline
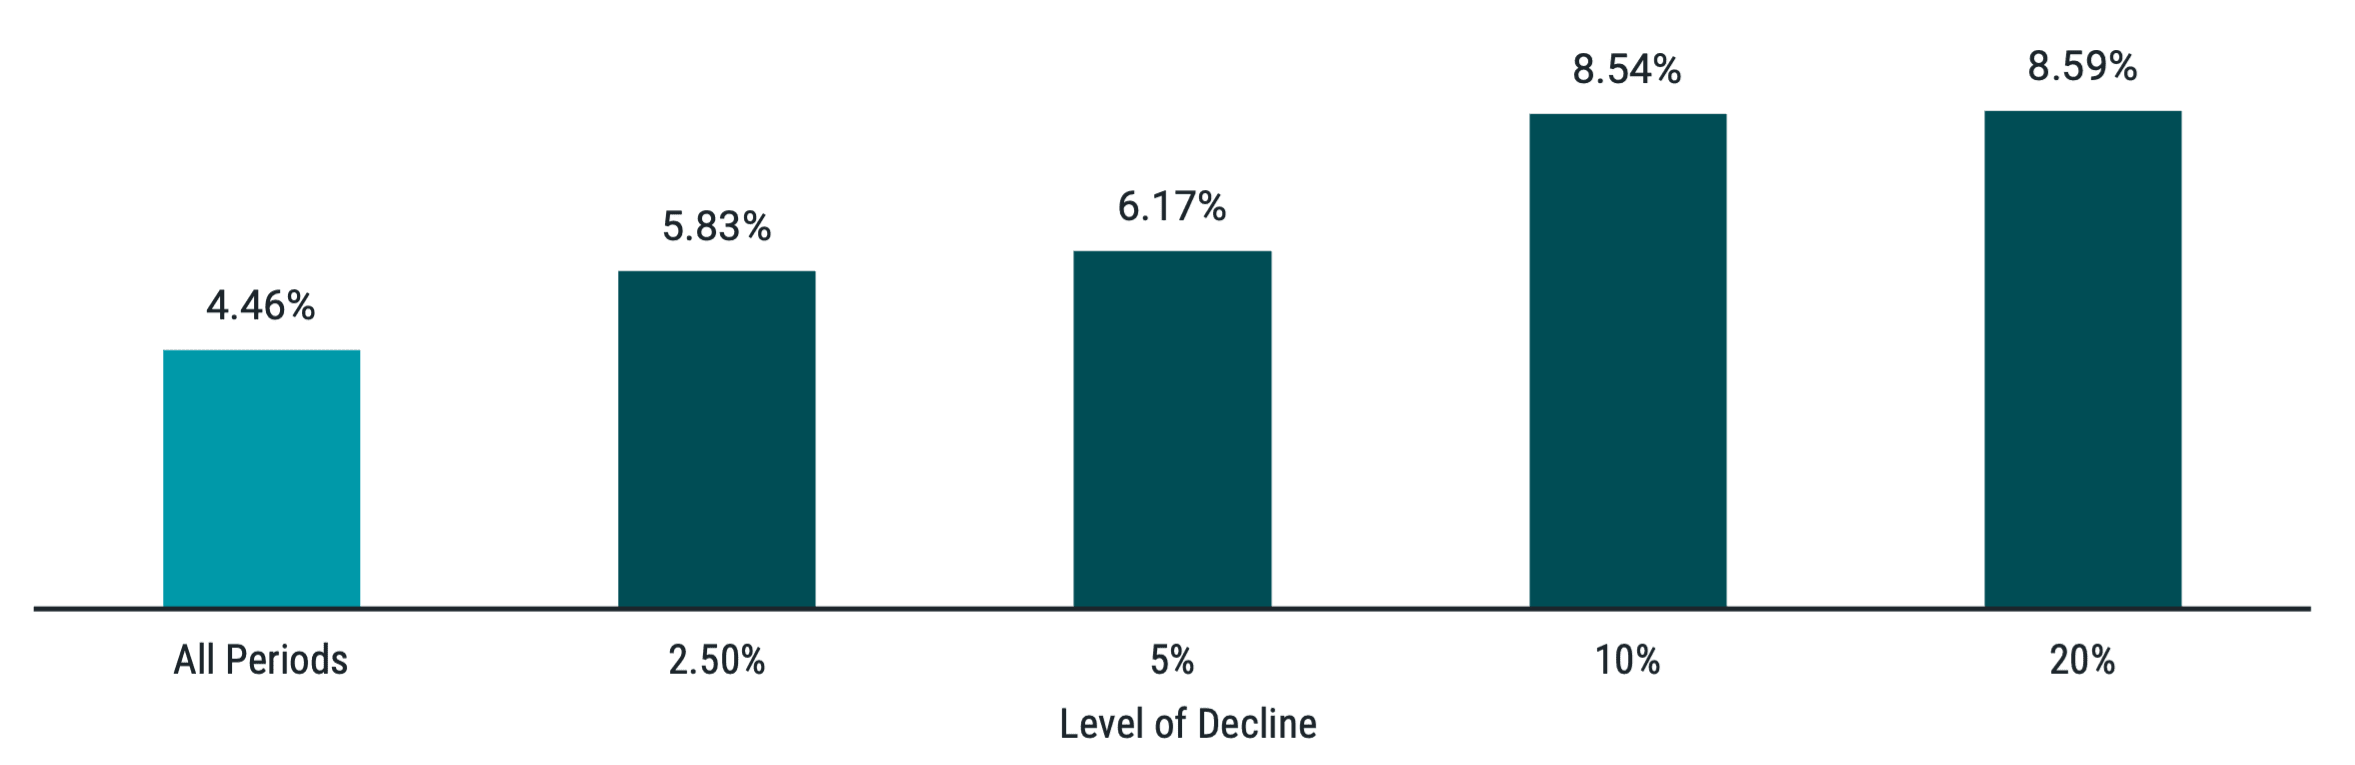
Data from 7/1/1926 - 2/28/2025. U.S. stocks sourced from the Center for Research in Security Prices (CRSP) include all firms incorporated in the US and listed on the NYSE, AMEX, or NASDAQ. Source: Avantis Investors. Past performance is no guarantee of future results.
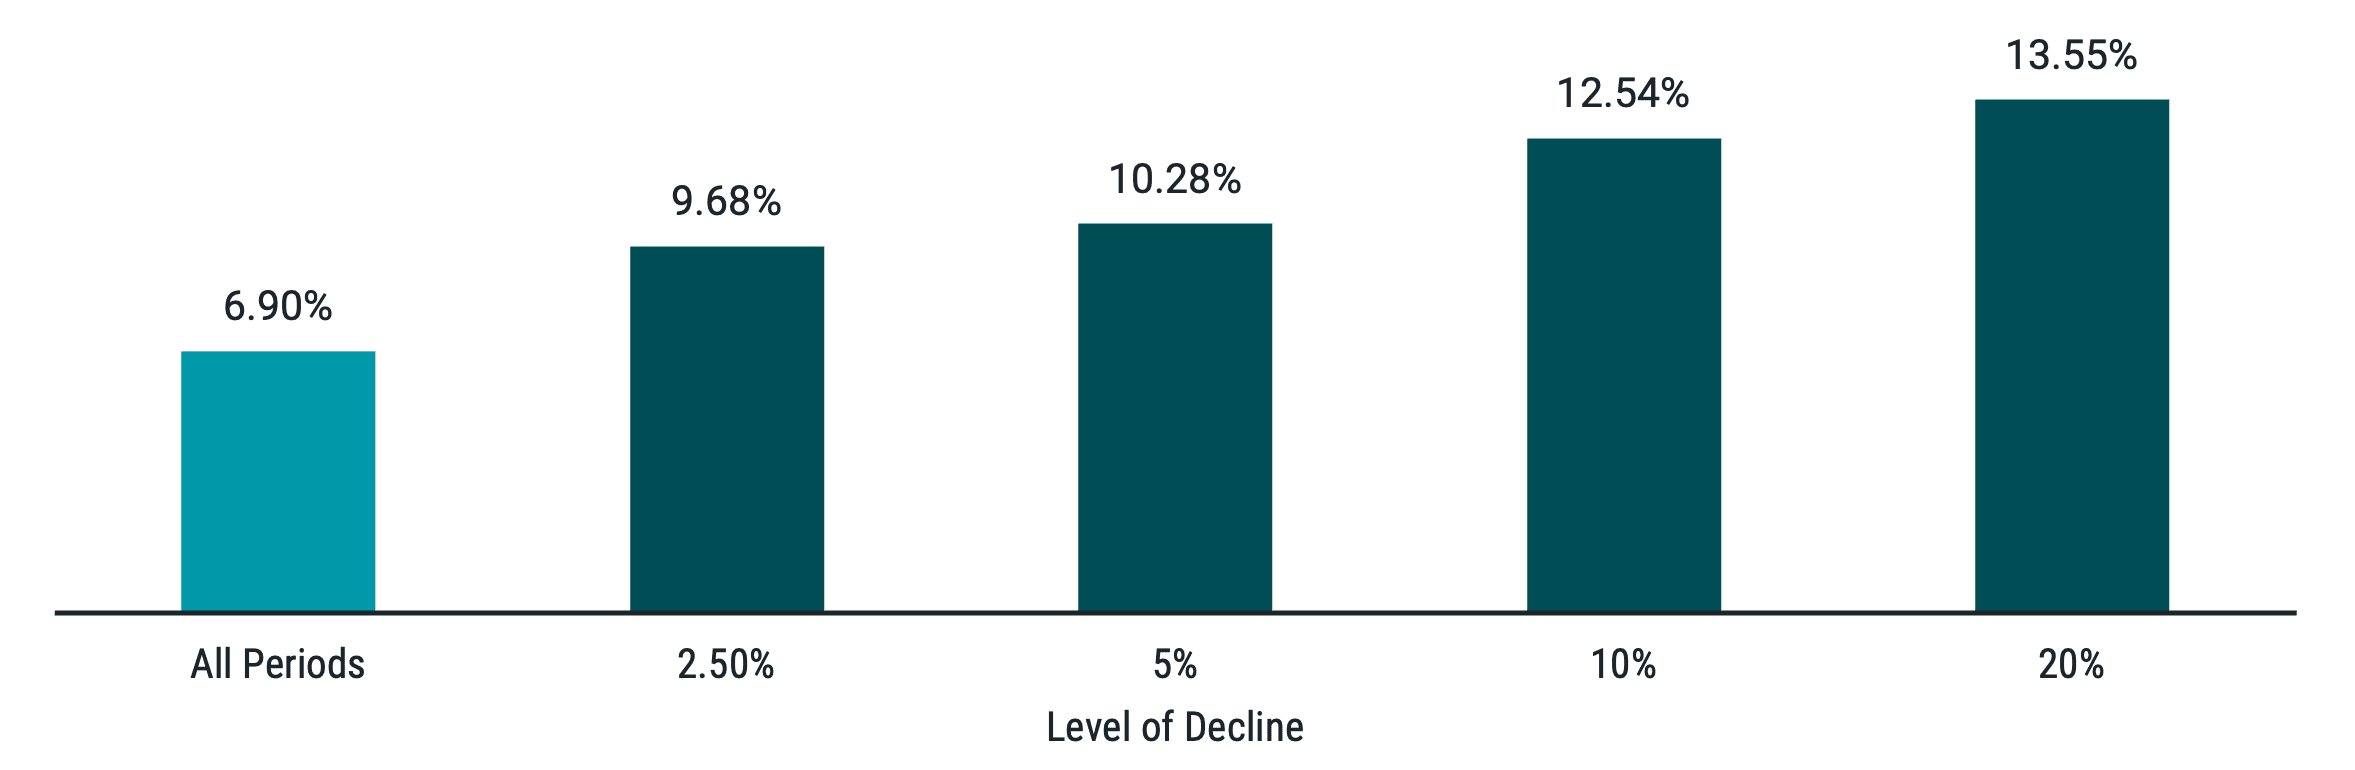
In Panel A, we take the same data from Figure 1 to show how U.S. stocks have performed on average in the 100 days following a market bottom at varying levels of decline (2.5%, 5%, 10%, and 20%).
Comparing the results versus the average over all the 100-day periods since 1926 (4.46%) highlights how the market tends to rebound quickly once it begins. For example, when the market has bottomed at a decline of 10% or more, the average return over the next 100 days has been 8.54% — nearly double the average over all 100-day periods!
In Panel B, we show the results of the same analysis applied to U.S. small-value stocks. We see the same patterns but with even larger magnitudes. This is what tends to happen after market anxiety and uncertainty subsides. Discount rates (the return investors demand to hold stocks) can go down fast, sending prices up in a hurry. Missing out on those times can have a big impact on investor results.
Diversification Can Help (and Has Lately)
While we’ve focused on U.S. stocks, there’s far more to the investable opportunity set. Diversification in investor portfolios has well-known benefits, including the potential to benefit from some asset classes performing well while others aren’t. That’s been a silver lining for many so far in 2025.
If we consider broad equity markets, exposure to markets beyond the U.S. has generally helped investors this year (Figure 3). It’s a short period, but those who held globally diversified portfolios will still likely be happy they did.
More broadly, it’s a healthy reminder to investors that global diversification still matters after an extended period of U.S. outperformance. We shouldn’t expect any single market to outperform over all periods. Diversifying across all markets means you will hold the highest performing markets as well as those that don’t do as well. Importantly, you know that you’ll avoid holding only the worst performers.
Figure 3 | Global Diversification Has Helped Equity Investors in 2025
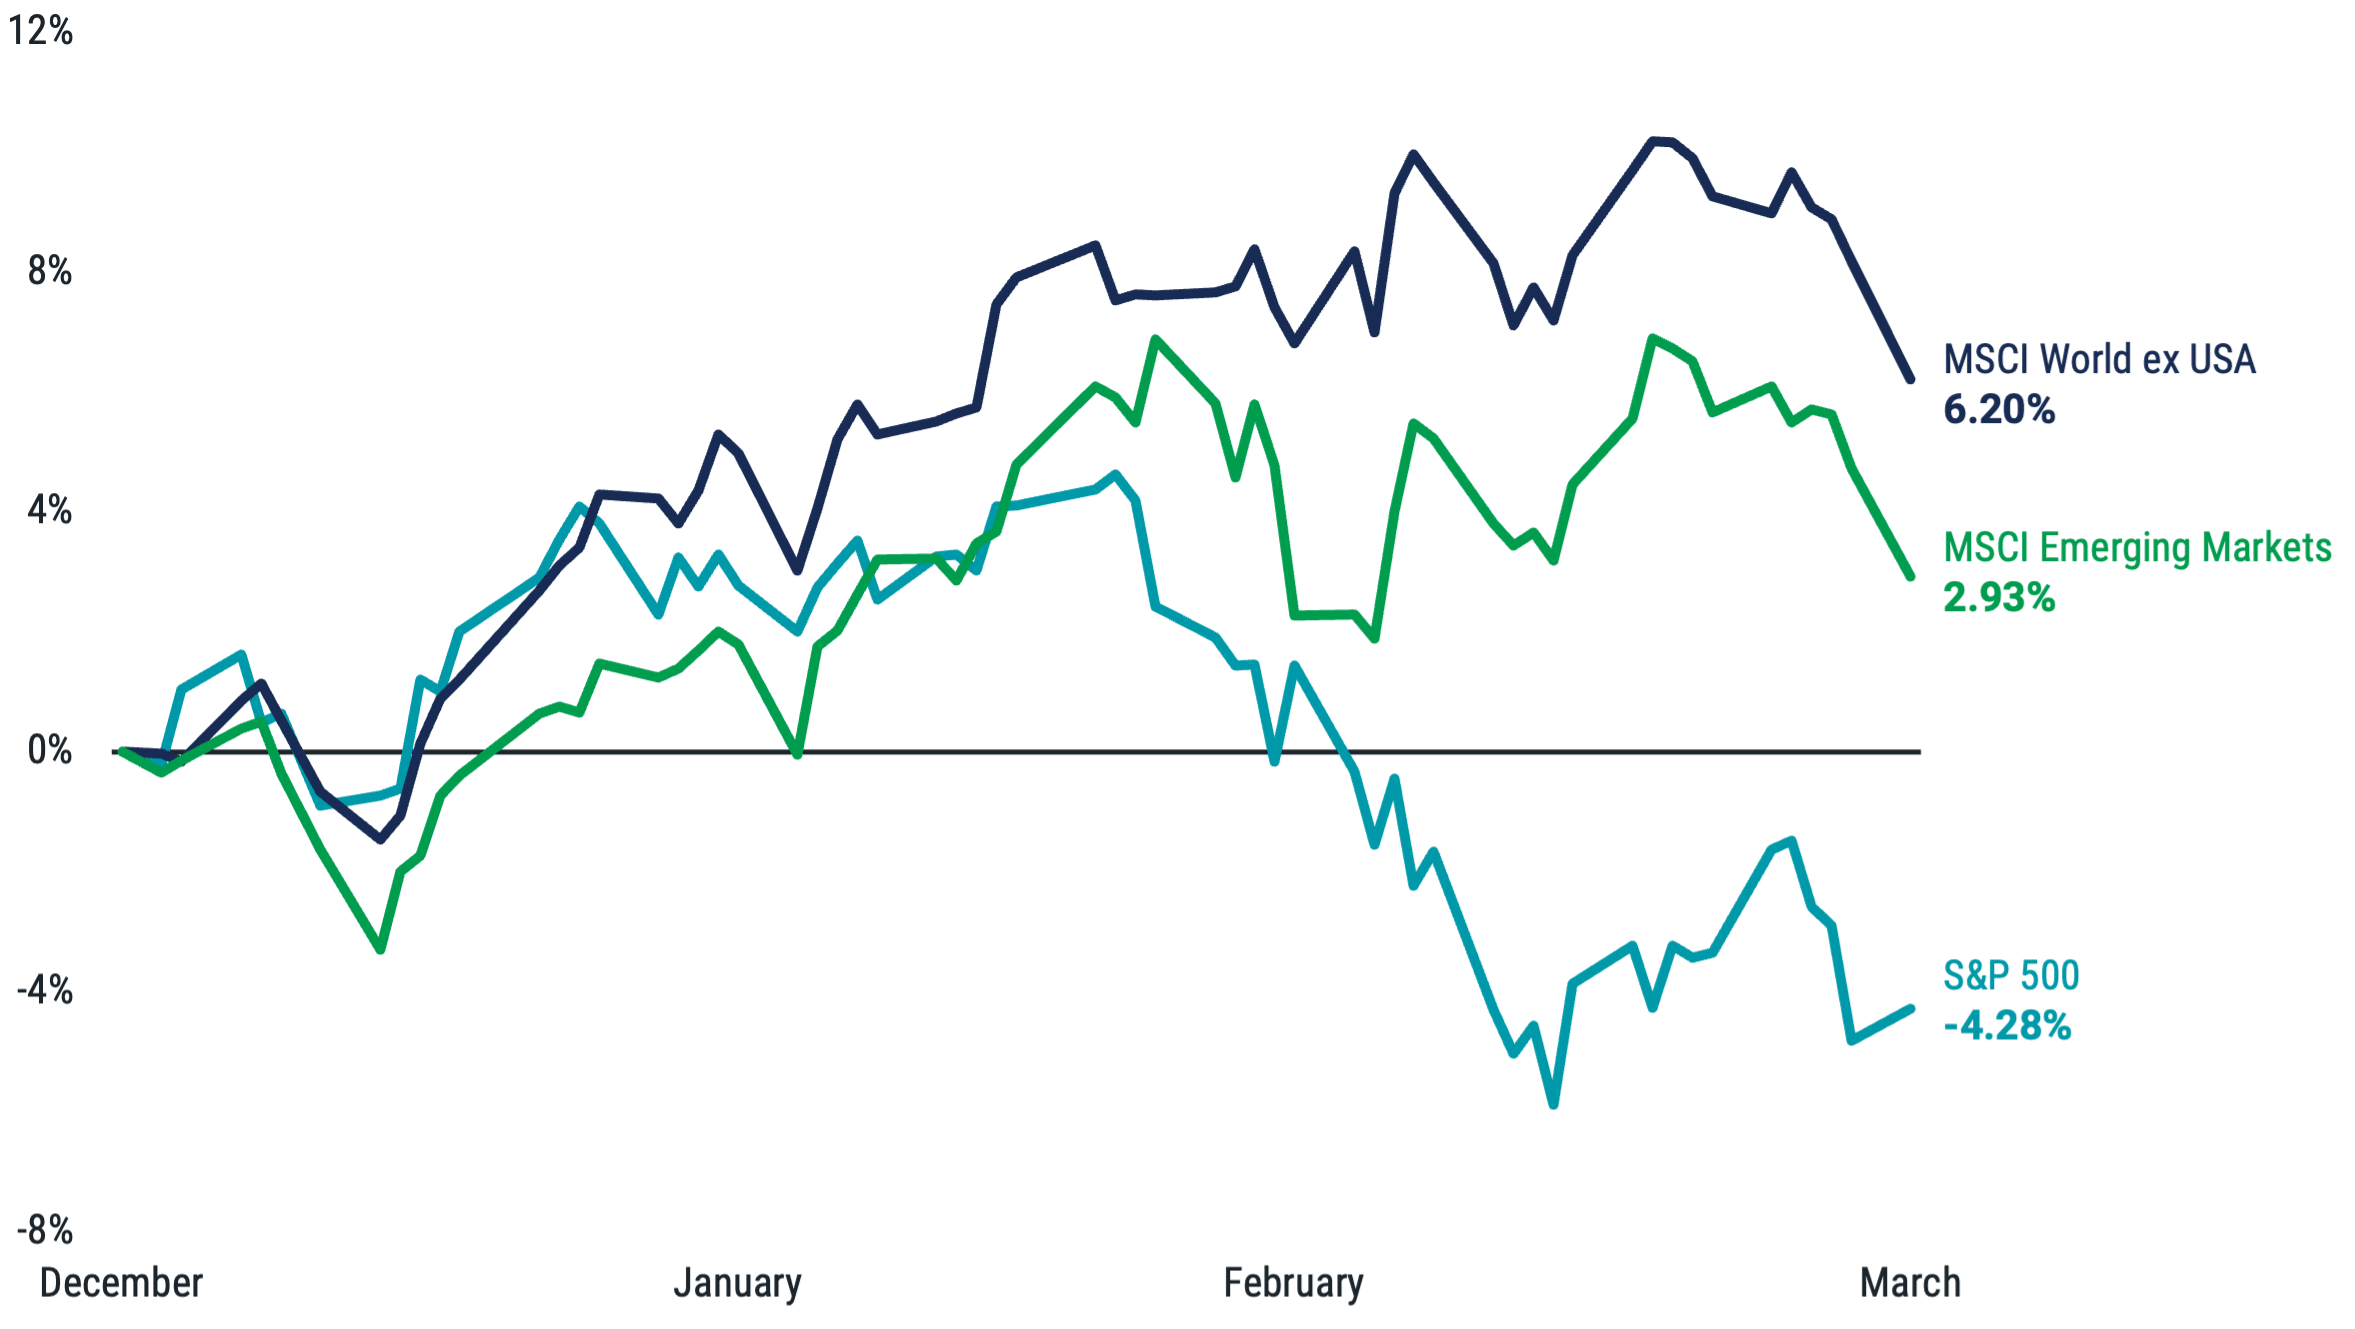
Data from 12/31/2024 - 3/31/2025. Source: Avantis Investors, Bloomberg. Diversification does not assure a profit, nor does it protect against loss of principal. Past performance is no guarantee of future results.
Managing Financial Uncertainty: Strategies for a Brighter Future
We shouldn’t discount how we feel as investors in the current environment. It’s normal to feel anxiety when there are more unknowns and uncertainty than before. After all, for many investors, our life savings and retirement nest egg are exposed to these potentially concerning forces.
But investing is about weathering the storms. Periods of higher volatility and market declines are part of the experience of investing in the market. These are not isolated events. They happen with higher frequency than many may realize (see Figure 4). Despite these events, the market has historically rewarded disciplined investors who stay the course to find the sun beyond the clouds.
Figure 4 | Expect Bumps in the Road on Your Long-Term Investment Journey
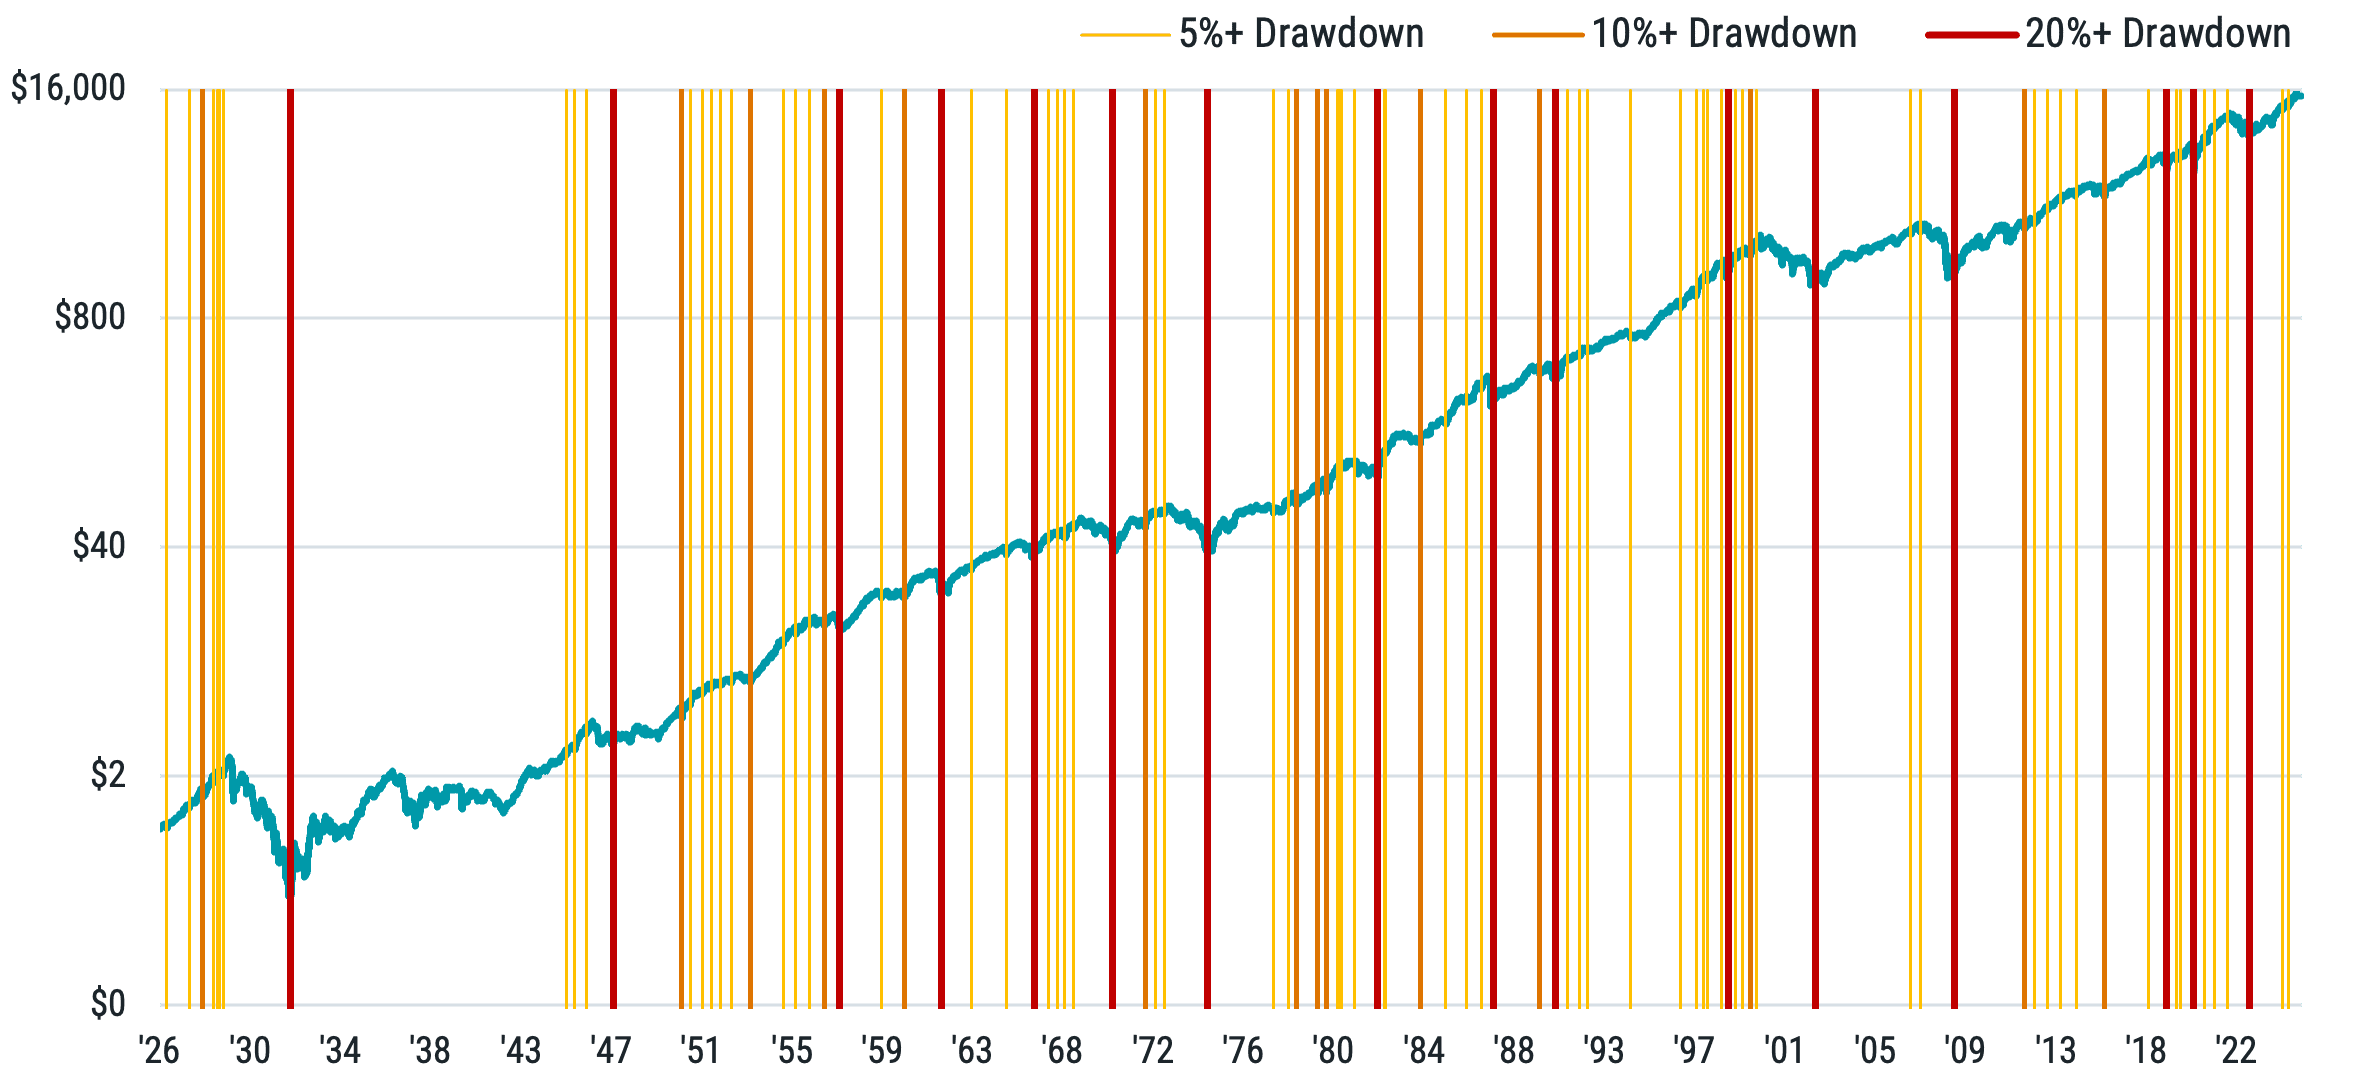
Returns data from 7/1/1926 - 3/6/2025. U.S. stocks sourced from the Center for Research in Security Prices (CRSP) include all firms incorporated in the US and listed on the NYSE, AMEX, or NASDAQ. Drawdowns are calculated from market peaks to subsequent bottoms. Past performance is no guarantee of future results. This hypothetical situation contains assumptions that are intended for illustrative purposes only and are not representative of the performance of any security. There is no assurance similar results can be achieved, and this information should not be relied upon as a specific recommendation to buy or sell securities.
Explore More Insights
Glossary
Magnificent Seven: This phrase refers to seven stocks that have been high-performing in the technology sector — Alphabet, Amazon, Apple, Meta Platforms, Microsoft, NVIDIA and Tesla.
MSCI Emerging Markets IMI Index: Captures large-, mid- and small-cap securities across 27 emerging markets countries.
MSCI World ex USA IMI Index: Captures large-, mid- and small-cap representation across 22 of 23 developed markets countries, excluding the U.S.
S&P 500® Index: A market-capitalization-weighted index of the 500 largest U.S. publicly traded companies. The index is widely regarded as the best gauge of large-cap U.S. equities.
Diversification does not assure a profit nor does it protect against loss of principal.
Investment return and principal value of security investments will fluctuate. The value at the time of redemption may be more or less than the original cost. Past performance is no guarantee of future results.
This material has been prepared for educational purposes only. It is not intended to provide, and should not be relied upon for, investment, accounting, legal or tax advice.
The opinions expressed are those of the portfolio team and are no guarantee of the future performance of any Avantis fund.
References to specific securities are for illustrative purposes only and are not intended as recommendations to purchase or sell securities. Opinions and estimates offered constitute our judgment and, along with other portfolio data, are subject to change without notice.