Check-Up Time: A Mid-Year Market Review

Key Takeaways
The S&P 500® Index has risen over 6% in early 2025 despite economic and geopolitical tensions.
Volatility peaked in April, driven by tariff news and policy shifts.
Investor discipline has proven to be valuable during 2025’s early uncertainty.
Imagine that at the start of the year, you were told over the next six months you’d see higher U.S. import tariffs, rising global trade tensions, shrinking gross domestic product (GDP) in the first quarter and an escalating conflict in the Middle East.
With that context, you were asked to predict the S&P 500® Index return for the first half of the year. What would you have guessed? Do you think you’d have guessed more than 6% — on pace to top the market’s average annual return of about 10%?
While that’s what has happened, it may seem remarkable that the market has faced such uncertainty and still delivered relatively strong returns. Of course, this simple summary doesn’t tell the whole story of the year's first half. Neither can a single chart, but it can get a lot closer.
For a more in-depth look back on the news and events of 2025, Figure 1 presents many of the major headlines atop the cumulative return of the S&P 500.
Figure 1 | All of the First Half of 2025 That Fits on One Page
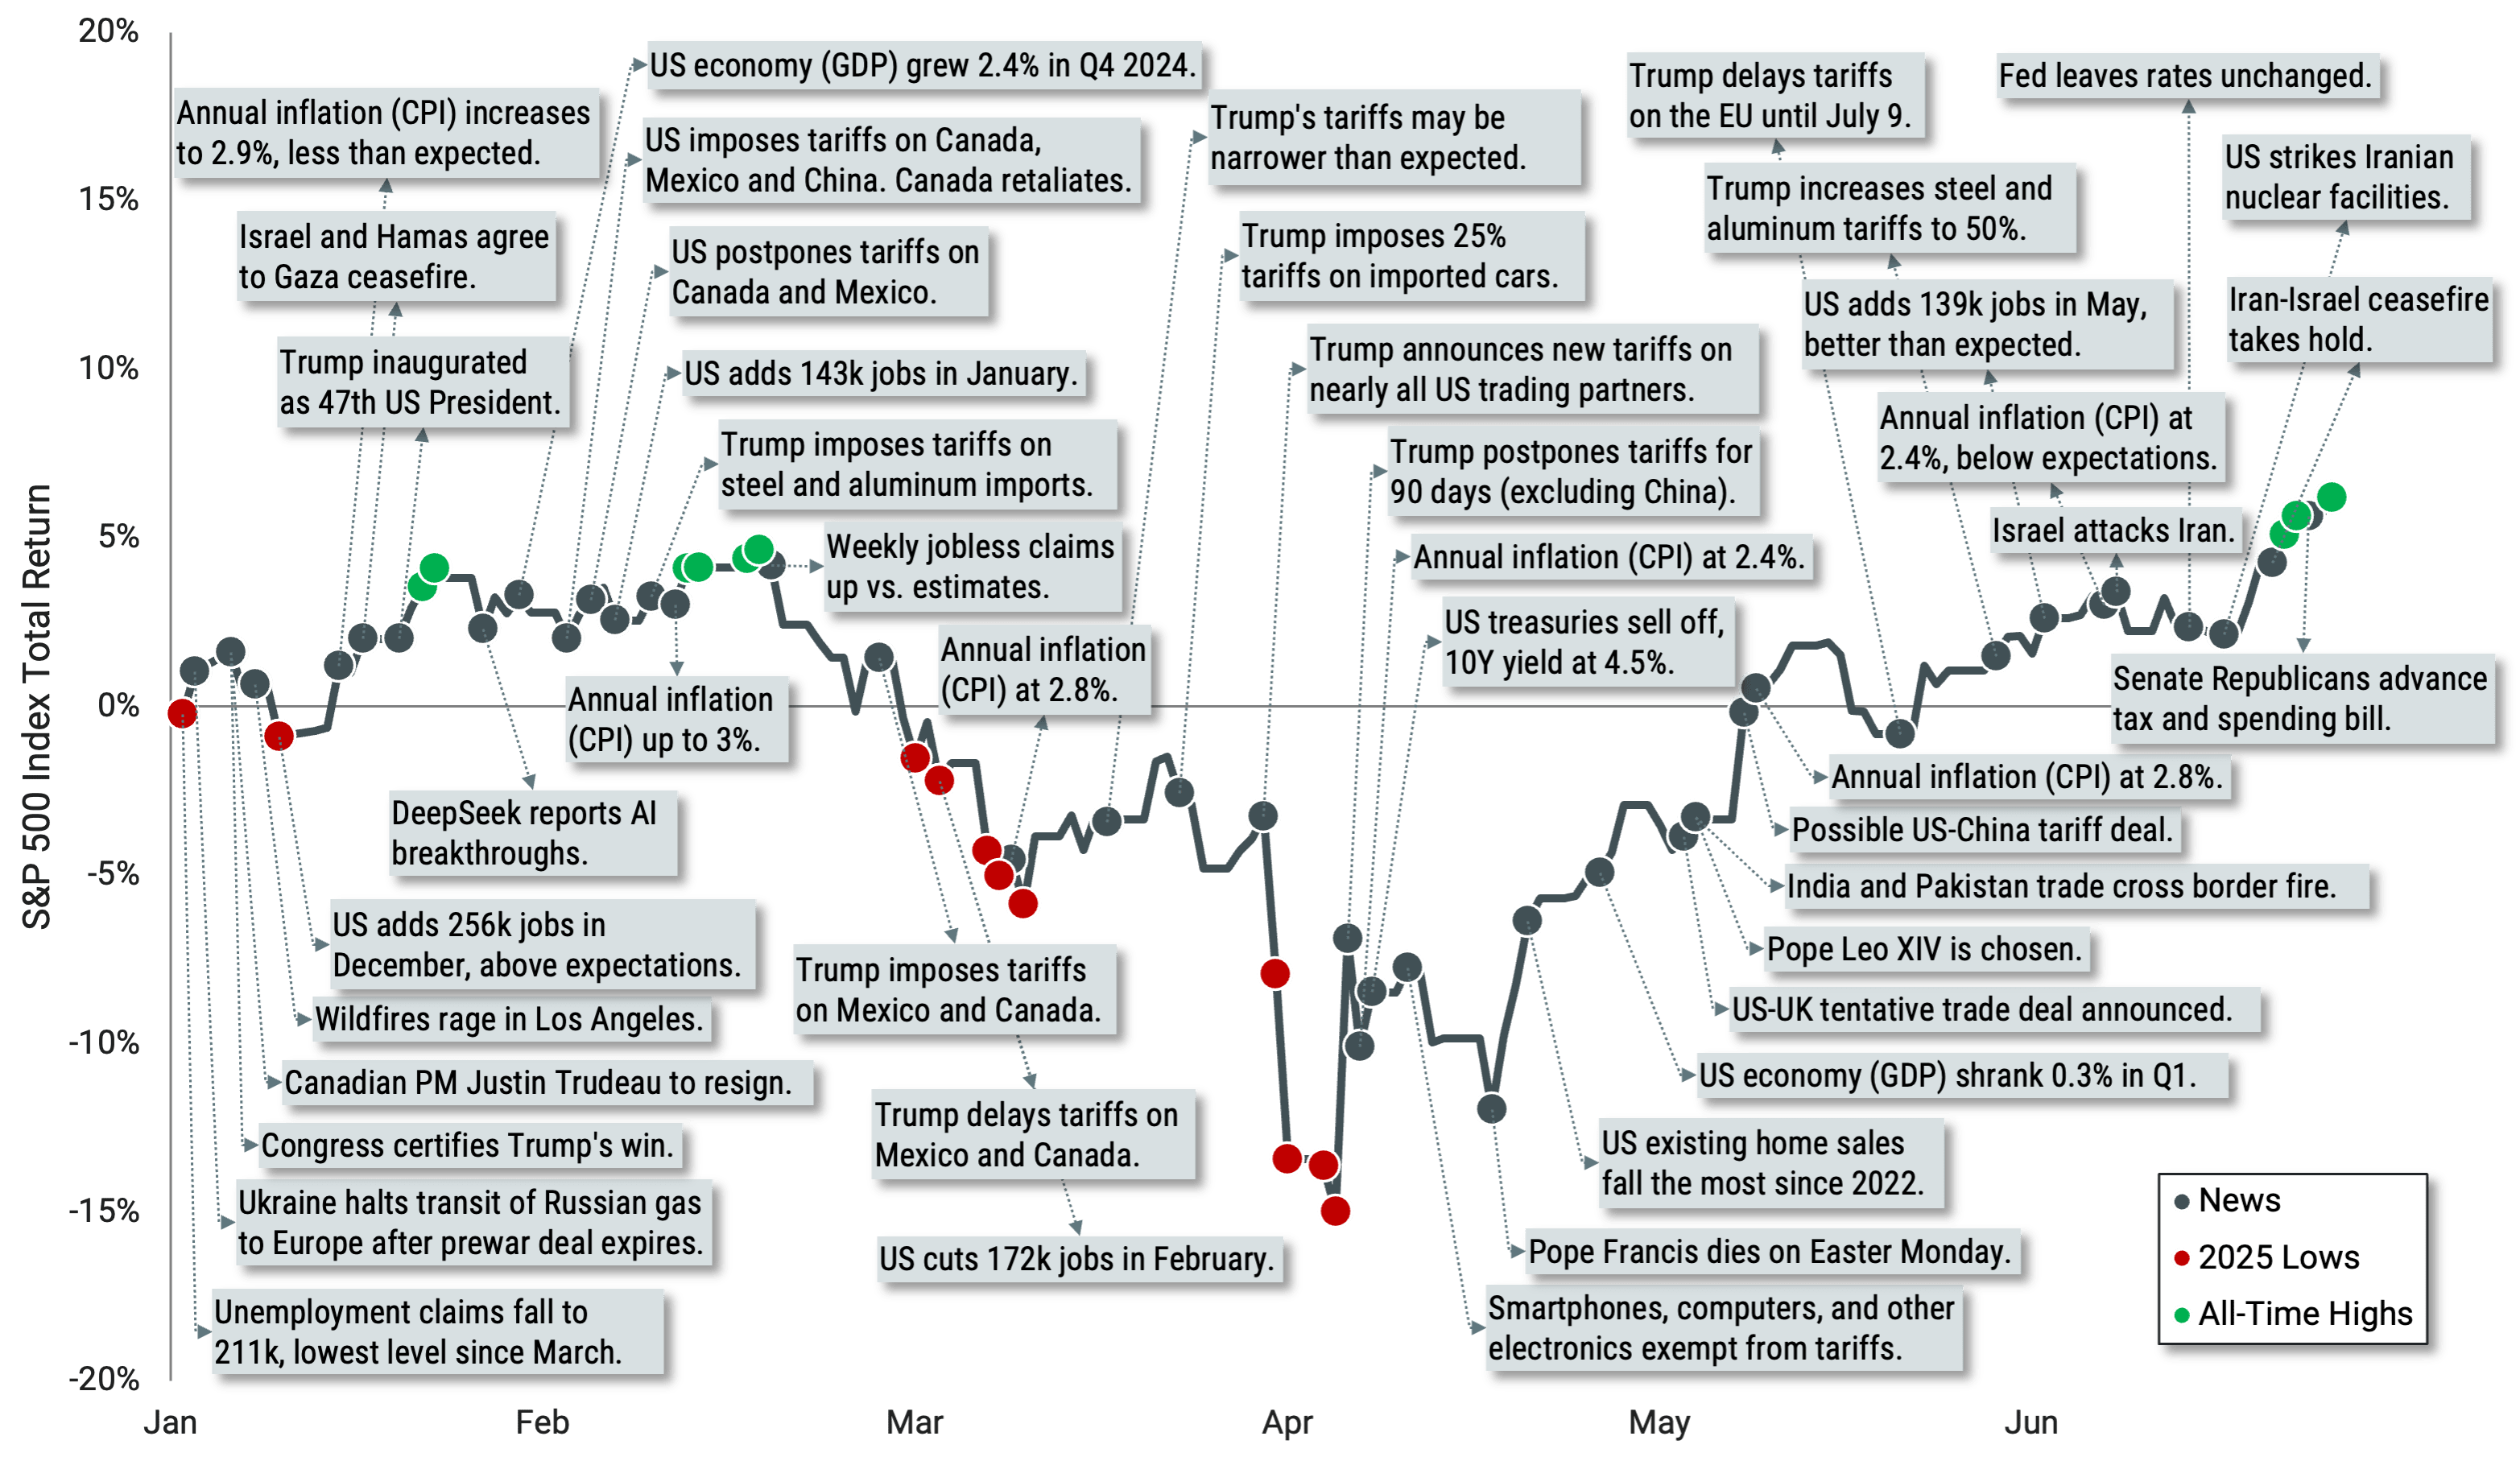
Data from 1/1/2025 - 6/30/2025. Source: Avantis Investors. Past performance is no guarantee of future results.
Volatility and Volume in Focus
In Figure 2, we present other interesting data points from the market that highlight what an incredible six months it has been. The magnitude of the highs and the lows, both over very short and longer periods, really stands out.
Figure 2 | S&P 500 Index by the Numbers
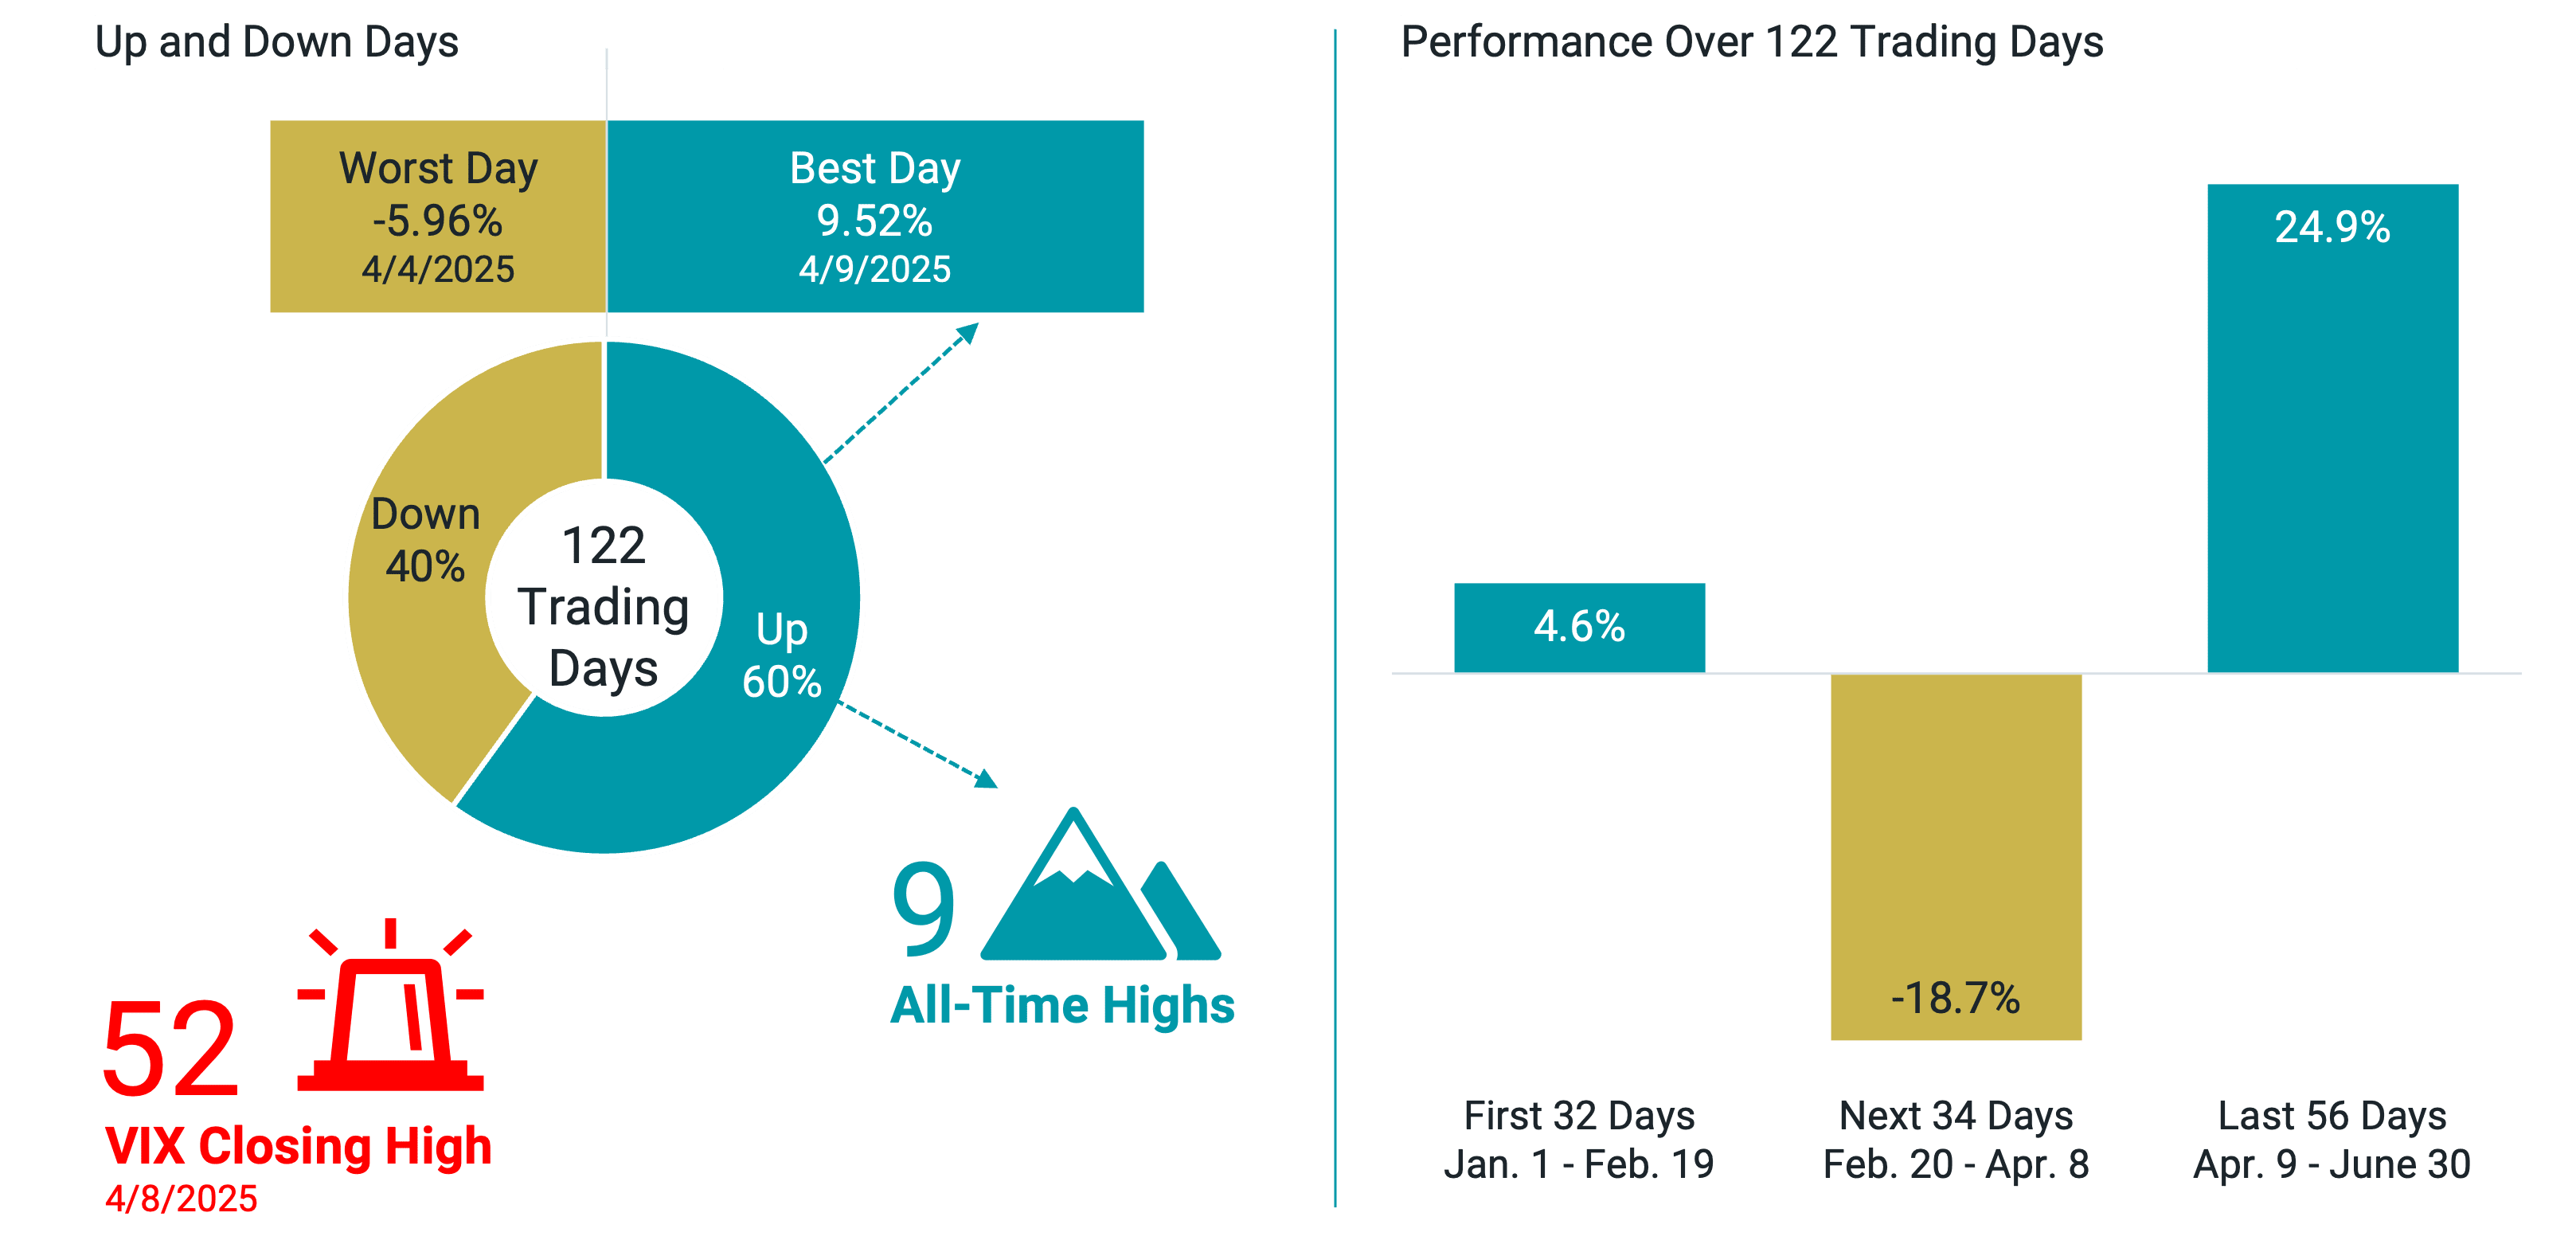
Data from 1/1/2025 - 6/30/2025. Source: Bloomberg and Avantis Investors. Past performance is no guarantee of future results.
This year, we’ve experienced some of the largest single-day market returns on record. The 9.5% rise for the S&P 500 on April 9 — the day President Donald Trump issued a 90-day tariff pause — was the largest daily gain since 2008 and the third largest since the index launched in 1957. This followed the 6.0% decline on April 4 — shortly after sweeping U.S. tariffs were announced — the 19th largest daily loss for the index.
There have also been nine S&P 500 all-time highs this year, some of which bookended notable subperiods for the market in 2025. One occurred on February 19, just before the index faced its largest drawdown of the year at nearly -19%, ending on April 8. Thereafter, the index rose almost 25% to end June again at a new all-time high.
These numbers provide helpful context for the investor experience over the period.
Staying Disciplined Amid Market Uncertainty
If you’re looking for salient takeaways from a period high on uncertainty, we have a few to share.
First, we should remember that our sentiment on the market or economy won’t always match how the market actually performs. We tend to weigh heavily what we perceive as bad news versus what we see as good news. This is normal, but it can lead investors to act on emotion driven by uncertainty and short-term pessimism. History has shown that doing so often results in poor portfolio outcomes.
Second, we should remember that markets constantly process the news, regardless of whether we individually see something as good or bad, and set prices that reflect aggregate, forward-looking expectations. In other words, markets look ahead, not just at what has happened, and price securities for positive expected returns going forward.
Finally, the near-term ups and downs can feel — and be — extreme in the moment. The aforementioned emotions and urge to “do something” can be intense. Investors experienced this in late February, March and early April.
But, as we also saw unfold over the next two months, those who kept a long-term view and remained disciplined in the face of uncertainty were again rewarded. The long-term plan you have set up shouldn’t be forgotten in times of market stress. It’s likely most useful in those very periods.
Explore More Insights
Glossary
Consumer Price Index (CPI): CPI is a U.S. government (Bureau of Labor Statistics) index derived from detailed consumer spending information. Headline CPI measures price changes in a market basket of consumer goods and services such as gas, food, clothing, and cars. Core CPI excludes food and energy prices, which tend to be volatile.
Expected Returns: Valuation theory shows that the expected return of a stock is a function of its current price, its book equity (assets minus liabilities) and expected future profits, and that the expected return of a bond is a function of its current yield and its expected capital appreciation (depreciation). We use information in current market prices and company financials to identify differences in expected returns among securities, seeking to overweight securities with higher expected returns based on this current market information. Actual returns may be different than expected returns, and there is no guarantee that the strategy will be successful.
Federal Reserve (Fed): The U.S. central bank, responsible for monetary policies affecting the U.S. financial system and the economy.
Gross Domestic Product (GDP): A measure of the total economic output in goods and services for an economy.
S&P 500® Index: A market-capitalization-weighted index of the 500 largest U.S. publicly traded companies. The index is widely regarded as the best gauge of large-cap U.S. equities.
VIX index: Managed by the Chicago Board of Trade (CBOE). It tracks the expected 30-day future volatility of the S&P 500 Index. It is a widely used measure of market risk and is often referred to as the "investor fear gauge.“
Diversification does not assure a profit nor does it protect against loss of principal.
Investment return and principal value of security investments will fluctuate. The value at the time of redemption may be more or less than the original cost. Past performance is no guarantee of future results.
This material has been prepared for educational purposes only. It is not intended to provide, and should not be relied upon for, investment, accounting, legal or tax advice.
The opinions expressed are those of the investment portfolio team and are no guarantee of the future performance of any Avantis Investors portfolio.